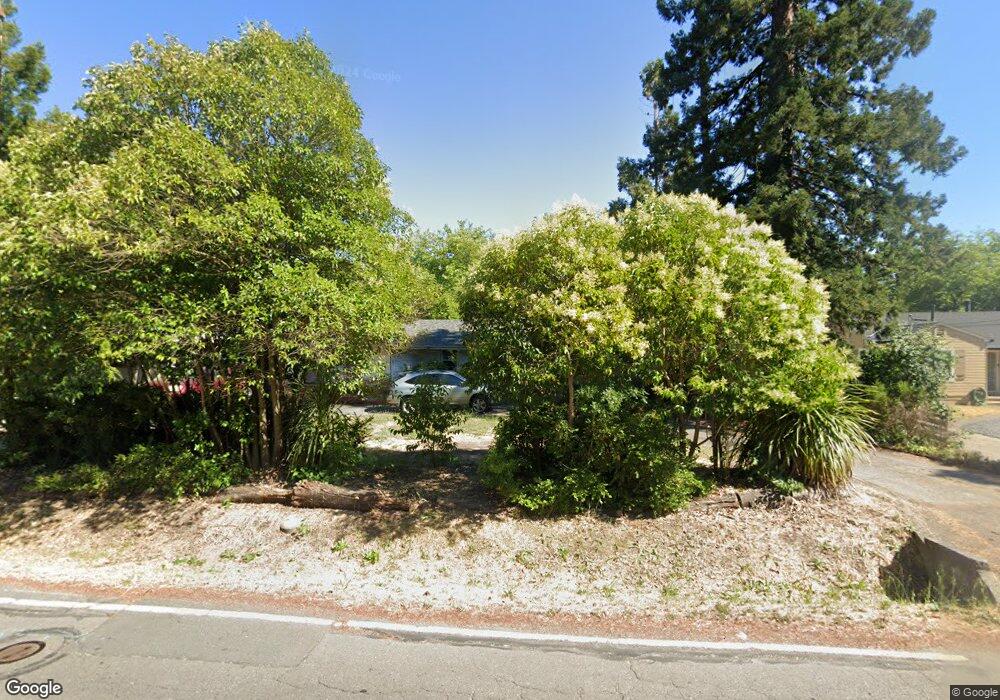
1216 Edwards Ave Santa Rosa, CA 95401
Northwest Santa Rosa NeighborhoodEstimated Value: $769,000 - $867,161
3
Beds
2
Baths
2,078
Sq Ft
$397/Sq Ft
Est. Value
About This Home
This home is located at 1216 Edwards Ave, Santa Rosa, CA 95401 and is currently estimated at $825,540, approximately $397 per square foot. 1216 Edwards Ave is a home located in Sonoma County with nearby schools including Helen M. Lehman Elementary School, Hilliard Comstock Middle School, and Santa Rosa High School.
Ownership History
Date
Name
Owned For
Owner Type
Purchase Details
Closed on
Jul 30, 2025
Sold by
Overton Noah and Overton Elissa
Bought by
London Laurel and Dixon William
Current Estimated Value
Home Financials for this Owner
Home Financials are based on the most recent Mortgage that was taken out on this home.
Original Mortgage
$751,500
Outstanding Balance
$750,861
Interest Rate
6.81%
Mortgage Type
New Conventional
Estimated Equity
$74,679
Purchase Details
Closed on
Aug 13, 2009
Sold by
Torgelson Steven and Allingham Caronanne
Bought by
Overton Noah and Overton Elissa
Home Financials for this Owner
Home Financials are based on the most recent Mortgage that was taken out on this home.
Original Mortgage
$365,752
Interest Rate
5.3%
Mortgage Type
FHA
Purchase Details
Closed on
Jun 25, 2008
Sold by
Torgelson Clarence C
Bought by
Torgelson Clarence C and Clarence C Torgelson Revocable
Create a Home Valuation Report for This Property
The Home Valuation Report is an in-depth analysis detailing your home's value as well as a comparison with similar homes in the area
Home Values in the Area
Average Home Value in this Area
Purchase History
| Date | Buyer | Sale Price | Title Company |
|---|---|---|---|
| London Laurel | $835,000 | Old Republic Title Company | |
| Overton Noah | $372,500 | Fidelity National Title Co | |
| Torgelson Clarence C | -- | None Available |
Source: Public Records
Mortgage History
| Date | Status | Borrower | Loan Amount |
|---|---|---|---|
| Open | London Laurel | $751,500 | |
| Previous Owner | Overton Noah | $365,752 |
Source: Public Records
Tax History Compared to Growth
Tax History
| Year | Tax Paid | Tax Assessment Tax Assessment Total Assessment is a certain percentage of the fair market value that is determined by local assessors to be the total taxable value of land and additions on the property. | Land | Improvement |
|---|---|---|---|---|
| 2025 | $5,503 | $480,818 | $193,616 | $287,202 |
| 2024 | $5,503 | $471,391 | $189,820 | $281,571 |
| 2023 | $5,503 | $462,149 | $186,099 | $276,050 |
| 2022 | $5,082 | $453,088 | $182,450 | $270,638 |
| 2021 | $5,020 | $444,205 | $178,873 | $265,332 |
| 2020 | $5,008 | $439,651 | $177,039 | $262,612 |
| 2019 | $4,981 | $431,031 | $173,568 | $257,463 |
| 2018 | $4,951 | $422,580 | $170,165 | $252,415 |
| 2017 | $4,862 | $414,295 | $166,829 | $247,466 |
| 2016 | $4,826 | $406,172 | $163,558 | $242,614 |
| 2015 | $4,681 | $400,072 | $161,102 | $238,970 |
| 2014 | $4,396 | $392,236 | $157,947 | $234,289 |
Source: Public Records
Map
Nearby Homes
- 1580 Herbert St
- 1080 Tijuana Ct
- 2529 Coffey Ln
- 2618 Plata Ct
- 2513 Westberry Dr
- 528 Steele Ln
- 1890 Dorado Ct
- 2112 Berkeley Dr
- 2334 Iroquois St
- 1239 Eardley Ave
- 2597 Northcoast St
- 595 N Dutton Ave
- 2387 Meyers Dr
- 2595 Hardies Ln
- 2791 Mcbride Ln Unit 176
- 1605 Charlene Place
- 2147 W Steele Ln
- 109 Steele Ln
- 85 Estrella Dr
- 930 Kingwood St
- 1232 Edwards Ave
- 1200 Edwards Ave
- 1188 Edwards Ave
- 1011 Jennings Ave
- 969 Jennings Ave
- 1023 Jennings Ave
- 1252 Edwards Ave
- 1160 Edwards Ave
- 941 Jennings Ave
- 1532 Range Ave
- 1258 Edwards Ave
- 1128 Edwards Ave
- 951 Jennings Ave
- 1037 Jennings Ave
- 937 Jennings Ave
- 1520 Range Ave
- 1065 Jennings Ave
- 1100 Edwards Ave
- 1845 Aspen Leaf Ln