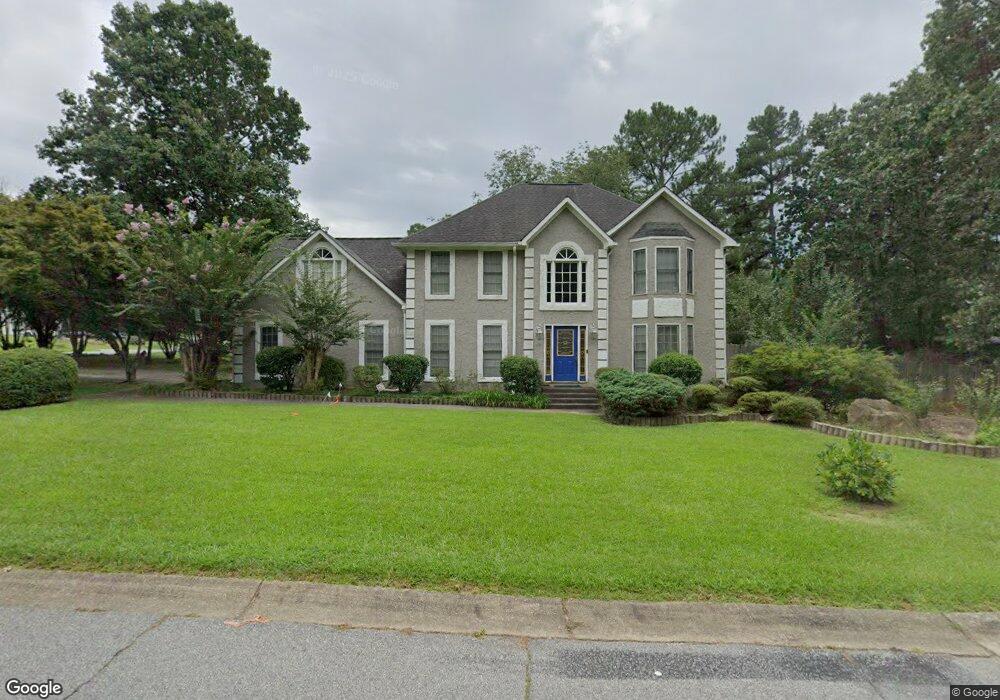
1216 Interlaken Pass Unit III Jonesboro, GA 30238
Estimated Value: $280,000 - $321,000
4
Beds
3
Baths
2,438
Sq Ft
$123/Sq Ft
Est. Value
About This Home
This home is located at 1216 Interlaken Pass Unit III, Jonesboro, GA 30238 and is currently estimated at $300,605, approximately $123 per square foot. 1216 Interlaken Pass Unit III is a home located in Clayton County with nearby schools including Kemp Primary School, Kemp Elementary School, and Mundys Mill Middle School.
Ownership History
Date
Name
Owned For
Owner Type
Purchase Details
Closed on
Mar 1, 2002
Sold by
Citifinancial Mtg Co Inc
Bought by
Mccrary Rita D
Current Estimated Value
Home Financials for this Owner
Home Financials are based on the most recent Mortgage that was taken out on this home.
Original Mortgage
$117,900
Outstanding Balance
$48,869
Interest Rate
6.95%
Mortgage Type
New Conventional
Estimated Equity
$251,736
Purchase Details
Closed on
Nov 6, 2001
Sold by
Watkins Sheila D
Bought by
Citifinancial Mtg Co Inc
Purchase Details
Closed on
Dec 28, 1999
Sold by
George Derrick
Bought by
Watkins Sheila D
Home Financials for this Owner
Home Financials are based on the most recent Mortgage that was taken out on this home.
Original Mortgage
$124,000
Interest Rate
7.88%
Mortgage Type
New Conventional
Purchase Details
Closed on
Jul 19, 1999
Sold by
Mitchell Lesa
Bought by
George Derrick
Purchase Details
Closed on
Oct 17, 1996
Sold by
Anderberg Roger D Kimmie T
Bought by
Mitchell Lesa and George Derrick
Create a Home Valuation Report for This Property
The Home Valuation Report is an in-depth analysis detailing your home's value as well as a comparison with similar homes in the area
Home Values in the Area
Average Home Value in this Area
Purchase History
| Date | Buyer | Sale Price | Title Company |
|---|---|---|---|
| Mccrary Rita D | $147,900 | -- | |
| Citifinancial Mtg Co Inc | $118,400 | -- | |
| Watkins Sheila D | $155,000 | -- | |
| George Derrick | -- | -- | |
| Mitchell Lesa | $138,500 | -- |
Source: Public Records
Mortgage History
| Date | Status | Borrower | Loan Amount |
|---|---|---|---|
| Open | Mccrary Rita D | $117,900 | |
| Previous Owner | Watkins Sheila D | $124,000 | |
| Closed | Mitchell Lesa | $0 |
Source: Public Records
Tax History Compared to Growth
Tax History
| Year | Tax Paid | Tax Assessment Tax Assessment Total Assessment is a certain percentage of the fair market value that is determined by local assessors to be the total taxable value of land and additions on the property. | Land | Improvement |
|---|---|---|---|---|
| 2024 | $1,869 | $108,320 | $8,800 | $99,520 |
| 2023 | $3,722 | $103,080 | $8,800 | $94,280 |
| 2022 | $1,327 | $81,000 | $8,800 | $72,200 |
| 2021 | $1,053 | $66,040 | $8,800 | $57,240 |
| 2020 | $1,155 | $69,858 | $8,800 | $61,058 |
| 2019 | $2,359 | $67,181 | $8,000 | $59,181 |
| 2018 | $2,170 | $62,528 | $8,000 | $54,528 |
| 2017 | $2,114 | $61,010 | $8,000 | $53,010 |
| 2016 | $1,989 | $57,942 | $8,000 | $49,942 |
| 2015 | $1,431 | $0 | $0 | $0 |
| 2014 | $1,071 | $35,958 | $10,000 | $25,958 |
Source: Public Records
Map
Nearby Homes
- 1172 Faulkner Way
- 1253 Todiway Ct
- 1296 Todiway Ct
- 10065 Brass Ring Rd
- 10085 Brass Ring Rd
- 1091 Commons Ct Unit 2
- 10200 Commons Crossing Unit 1
- 10197 Hamilton Glen
- 1352 Labelle St
- 1131 Orr Rd
- 9997 Point View Dr
- 1157 Mundys Mill Rd
- 1147 Dunivin Dr
- 9744 Carolina Dr
- 1036 Walnut Creek Ln
- 1478 Interlaken Pass
- 1241 Larkwood Dr
- 1485 Bola Ct
- 10248 Briarbay Loop
- 979 Walnut Creek Ln
- 1212 Interlaken Pass Unit III
- 1222 Interlaken Pass
- 1208 Interlaken Pass
- 10279 Cormac St Unit 189 - Everest III
- 1215 Interlaken Pass Unit III
- 1221 Interlaken Pass Unit 3/22
- 1221 Interlaken Pass
- 1226 Interlaken Pass Unit III
- 10247 Cormac St Unit 188 - Isabellla I
- 10285 Cormac St Unit 190
- 2194 Cormac St
- 2196 Cormac St
- 2193 Cormac St
- 2195 Cormac St
- 2197 Cormac St
- 1204 Interlaken Pass Unit 3
- 1205 Interlaken Pass
- 10241 Cormac St Unit 187 - Everest III
- 10291 Cormac St Unit 191 - Abigail I
- 1168 Gaines St Unit 103 - Abigail I