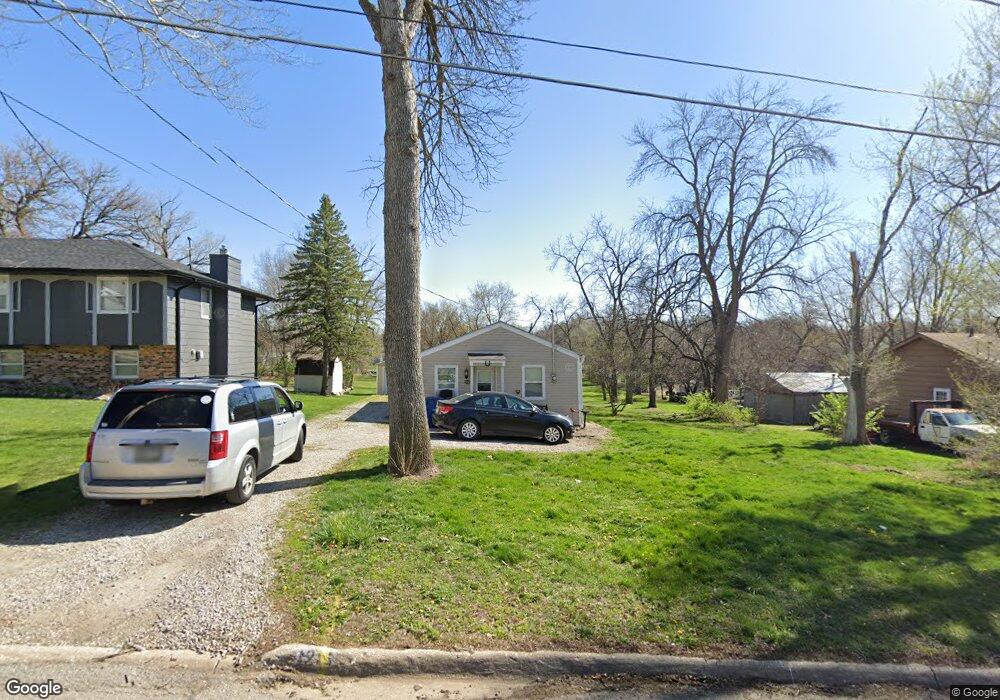
1216 Kenyon Ave Des Moines, IA 50315
Watrous South NeighborhoodEstimated Value: $103,000 - $157,000
1
Bed
1
Bath
680
Sq Ft
$194/Sq Ft
Est. Value
About This Home
This home is located at 1216 Kenyon Ave, Des Moines, IA 50315 and is currently estimated at $132,124, approximately $194 per square foot. 1216 Kenyon Ave is a home located in Polk County with nearby schools including Wright Elementary School, Brody Middle School, and Lincoln High School.
Ownership History
Date
Name
Owned For
Owner Type
Purchase Details
Closed on
Jun 26, 2018
Sold by
Maranatha Services Inc
Bought by
Emberlin Sandra S
Current Estimated Value
Purchase Details
Closed on
Jun 15, 2011
Sold by
Maranatha Services Inc
Bought by
Emberlin Sandra S
Purchase Details
Closed on
Nov 10, 2009
Sold by
Christ The King Catholic Church Of Fort
Bought by
Maranatha Services Inc and Kirkman Pat
Purchase Details
Closed on
Jul 17, 2009
Sold by
Lester Edward L and Lester Norma F
Bought by
Christ The King Catholic Church Of Fort
Purchase Details
Closed on
May 27, 2009
Sold by
Lester Mary L
Bought by
Lester Edward L and Lester Norma F
Purchase Details
Closed on
Jul 14, 2008
Sold by
Lester Edward L and Lester Norma F
Bought by
Lester Mary L
Purchase Details
Closed on
Jun 14, 2004
Sold by
Lester Norma Fay
Bought by
Lester Edward Leon and Lester Norma Fay
Create a Home Valuation Report for This Property
The Home Valuation Report is an in-depth analysis detailing your home's value as well as a comparison with similar homes in the area
Home Values in the Area
Average Home Value in this Area
Purchase History
| Date | Buyer | Sale Price | Title Company |
|---|---|---|---|
| Emberlin Sandra S | $49,000 | None Available | |
| Emberlin Sandra S | $43,000 | None Available | |
| Maranatha Services Inc | $38,000 | None Available | |
| Christ The King Catholic Church Of Fort | -- | None Available | |
| Lester Edward L | -- | None Available | |
| Lester Mary L | -- | None Available | |
| Lester Edward Leon | -- | -- |
Source: Public Records
Mortgage History
| Date | Status | Borrower | Loan Amount |
|---|---|---|---|
| Closed | Emberlin Sandra S | $0 |
Source: Public Records
Tax History Compared to Growth
Tax History
| Year | Tax Paid | Tax Assessment Tax Assessment Total Assessment is a certain percentage of the fair market value that is determined by local assessors to be the total taxable value of land and additions on the property. | Land | Improvement |
|---|---|---|---|---|
| 2025 | $1,826 | $106,400 | $53,700 | $52,700 |
| 2024 | $1,826 | $92,800 | $46,900 | $45,900 |
| 2023 | $1,812 | $92,800 | $46,900 | $45,900 |
| 2022 | $1,798 | $76,900 | $39,900 | $37,000 |
| 2021 | $1,720 | $76,900 | $39,900 | $37,000 |
| 2020 | $1,786 | $68,900 | $35,800 | $33,100 |
| 2019 | $1,678 | $68,900 | $35,800 | $33,100 |
| 2018 | $1,660 | $62,400 | $32,200 | $30,200 |
| 2017 | $1,644 | $62,400 | $32,200 | $30,200 |
| 2016 | $1,602 | $60,800 | $31,400 | $29,400 |
| 2015 | $1,602 | $60,800 | $31,400 | $29,400 |
| 2014 | $1,604 | $60,400 | $31,000 | $29,400 |
Source: Public Records
Map
Nearby Homes
- 1207 Kenyon Ave
- 1401 Cutler Ave
- 1243 Hackley Ave
- 5120 SW 14th St
- 1304 Wall Ave
- 4916 SW 13th St
- 1210 Highview Dr
- 5013 SW 16th St
- 1010 Frederick Ave
- 1229 Evans St
- 5407 SW 9th St
- 1605 Frazier Ave
- 5402 SW 8th St
- 1616 Porter Ave
- 1419 Payton Ave
- 6001 SW 13th Place
- 1616 Southlawn Dr
- 936 Mckinley Ave Unit 14
- 1116 Herold Ave
- 1810 Porter Ave
- 1212 Kenyon Ave
- 1220 Kenyon Ave
- 1210 Kenyon Ave
- 1224 Kenyon Ave
- 1215 Kenyon Ave
- 1211 Kenyon Ave
- 1221 Kenyon Ave
- 1206 Kenyon Ave
- 1209 Kenyon Ave
- 1230 Kenyon Ave
- 1236 Kenyon Ave
- 5413 SW 13th St
- 5419 SW 13th St
- 1218 Frazier Ave
- 1212 Frazier Ave
- 1202 Kenyon Ave
- 1210 Frazier Ave
- 1220 Frazier Ave
- 5423 SW 13th St
- 5407 SW 13th St