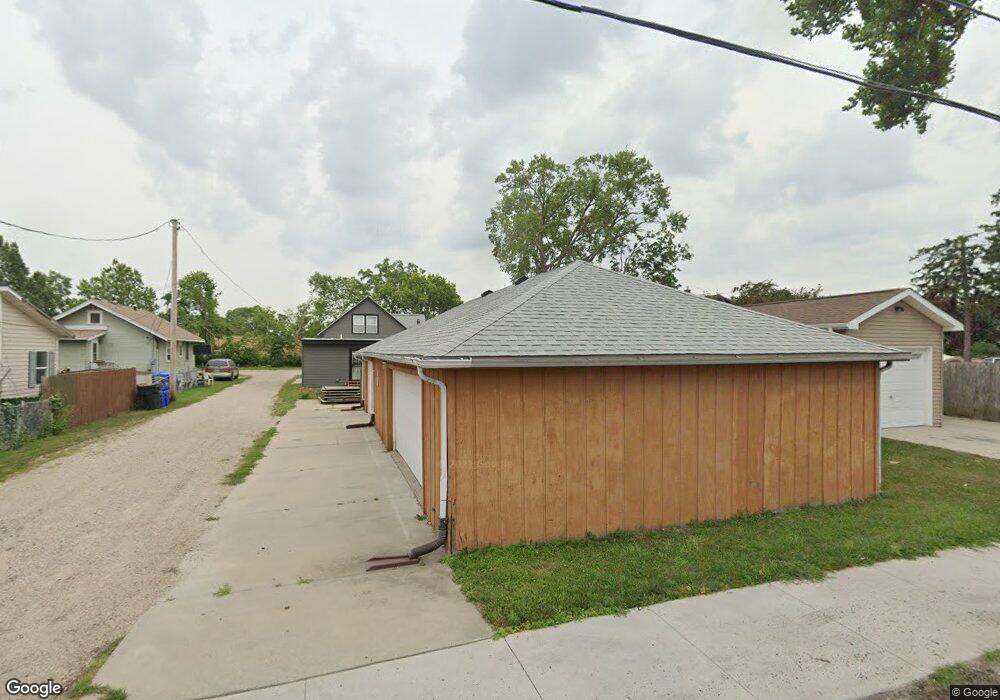
1216 L St SW Cedar Rapids, IA 52404
Taylor NeighborhoodEstimated Value: $119,000 - $146,284
2
Beds
2
Baths
1,290
Sq Ft
$107/Sq Ft
Est. Value
About This Home
This home is located at 1216 L St SW, Cedar Rapids, IA 52404 and is currently estimated at $137,571, approximately $106 per square foot. 1216 L St SW is a home with nearby schools including Junction City Elementary School, Cedar River Academy at Taylor Elementary School, and Bruce Hall Day Treatment Center.
Ownership History
Date
Name
Owned For
Owner Type
Purchase Details
Closed on
Jul 14, 2022
Sold by
Rice Virginia L and Rice Roger D
Bought by
Rice-Poole Virginia L and Poole Roger D
Current Estimated Value
Home Financials for this Owner
Home Financials are based on the most recent Mortgage that was taken out on this home.
Original Mortgage
$853,000
Outstanding Balance
$811,532
Interest Rate
5.09%
Mortgage Type
New Conventional
Estimated Equity
-$673,961
Purchase Details
Closed on
Jan 29, 2018
Sold by
Rosche John E
Bought by
Rice Virginia L and Rosche Virginia L
Purchase Details
Closed on
Mar 7, 2016
Sold by
Huberty Christopher R and Huberty Ruthann S
Bought by
Rosche John E and Rosche Virginia L
Create a Home Valuation Report for This Property
The Home Valuation Report is an in-depth analysis detailing your home's value as well as a comparison with similar homes in the area
Home Values in the Area
Average Home Value in this Area
Purchase History
| Date | Buyer | Sale Price | Title Company |
|---|---|---|---|
| Rice-Poole Virginia L | -- | None Listed On Document | |
| Rice Virginia L | -- | None Available | |
| Rosche John E | -- | None Available |
Source: Public Records
Mortgage History
| Date | Status | Borrower | Loan Amount |
|---|---|---|---|
| Open | Rice-Poole Virginia L | $853,000 |
Source: Public Records
Tax History Compared to Growth
Tax History
| Year | Tax Paid | Tax Assessment Tax Assessment Total Assessment is a certain percentage of the fair market value that is determined by local assessors to be the total taxable value of land and additions on the property. | Land | Improvement |
|---|---|---|---|---|
| 2025 | $1,846 | $128,100 | $22,700 | $105,400 |
| 2024 | $1,874 | $114,800 | $20,500 | $94,300 |
| 2023 | $1,874 | $114,800 | $20,500 | $94,300 |
| 2022 | $1,526 | $97,700 | $18,400 | $79,300 |
| 2021 | $1,466 | $82,600 | $18,400 | $64,200 |
| 2020 | $1,466 | $75,000 | $15,100 | $59,900 |
| 2019 | $1,570 | $72,800 | $15,100 | $57,700 |
| 2018 | $1,526 | $72,800 | $15,100 | $57,700 |
| 2017 | $1,414 | $69,900 | $15,100 | $54,800 |
| 2016 | $1,414 | $66,500 | $12,900 | $53,600 |
| 2015 | $1,524 | $69,076 | $12,852 | $56,224 |
| 2014 | $1,470 | $68,481 | $12,257 | $56,224 |
| 2013 | $1,426 | $68,481 | $12,257 | $56,224 |
Source: Public Records
Map
Nearby Homes