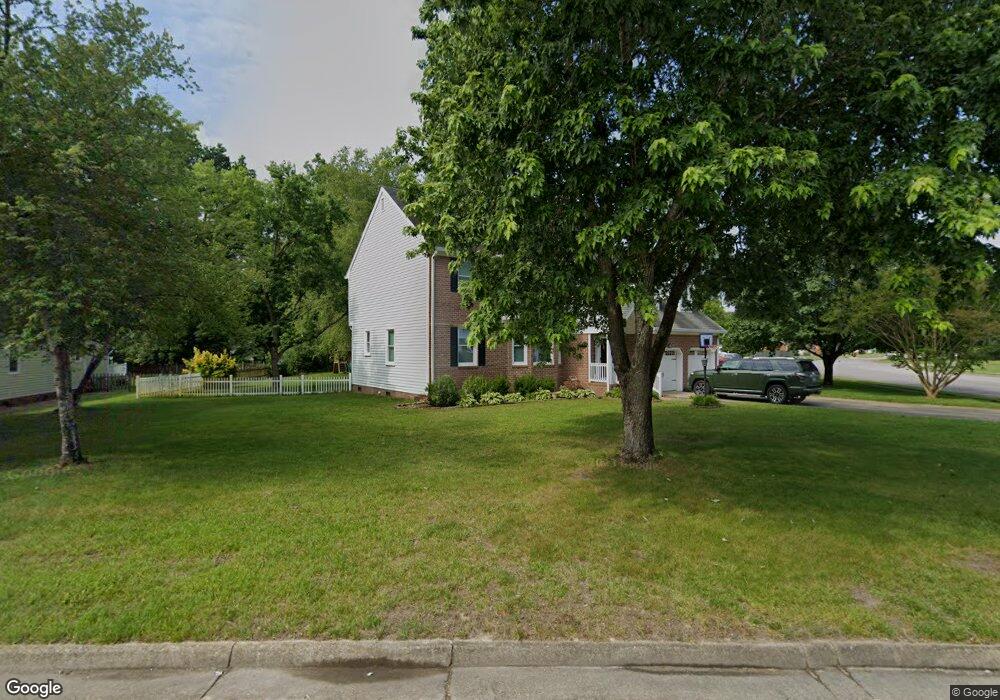
1216 Manor View Ct Chesapeake, VA 23321
Western Branch NeighborhoodEstimated Value: $499,000 - $560,000
4
Beds
3
Baths
3,000
Sq Ft
$178/Sq Ft
Est. Value
About This Home
This home is located at 1216 Manor View Ct, Chesapeake, VA 23321 and is currently estimated at $535,099, approximately $178 per square foot. 1216 Manor View Ct is a home located in Chesapeake City with nearby schools including Edwin W. Chittum Elementary School, Jolliff Middle School, and Western Branch High School.
Ownership History
Date
Name
Owned For
Owner Type
Purchase Details
Closed on
May 15, 2014
Sold by
Hullihan Jonathan K
Bought by
Manning Jeremiah M
Current Estimated Value
Home Financials for this Owner
Home Financials are based on the most recent Mortgage that was taken out on this home.
Original Mortgage
$316,825
Outstanding Balance
$242,268
Interest Rate
4.42%
Mortgage Type
New Conventional
Estimated Equity
$292,831
Purchase Details
Closed on
Aug 26, 2010
Sold by
Deutsche Bk Ntl Tr Co As Tr
Bought by
Hullihan Jonathan K
Home Financials for this Owner
Home Financials are based on the most recent Mortgage that was taken out on this home.
Original Mortgage
$234,945
Interest Rate
4.48%
Mortgage Type
VA
Purchase Details
Closed on
Feb 10, 2010
Sold by
Glasser And Glasser Plc and Naftaly Irving F
Bought by
Deutsche Bank National Tr Co
Create a Home Valuation Report for This Property
The Home Valuation Report is an in-depth analysis detailing your home's value as well as a comparison with similar homes in the area
Home Values in the Area
Average Home Value in this Area
Purchase History
| Date | Buyer | Sale Price | Title Company |
|---|---|---|---|
| Manning Jeremiah M | $333,500 | -- | |
| Hullihan Jonathan K | $230,000 | -- | |
| Deutsche Bank National Tr Co | $335,000 | -- |
Source: Public Records
Mortgage History
| Date | Status | Borrower | Loan Amount |
|---|---|---|---|
| Open | Manning Jeremiah M | $316,825 | |
| Previous Owner | Hullihan Jonathan K | $234,945 |
Source: Public Records
Tax History
| Year | Tax Paid | Tax Assessment Tax Assessment Total Assessment is a certain percentage of the fair market value that is determined by local assessors to be the total taxable value of land and additions on the property. | Land | Improvement |
|---|---|---|---|---|
| 2025 | $4,559 | $464,500 | $165,000 | $299,500 |
| 2024 | $4,559 | $451,400 | $150,000 | $301,400 |
| 2023 | $3,995 | $432,400 | $140,000 | $292,400 |
| 2022 | $4,017 | $397,700 | $130,000 | $267,700 |
| 2021 | $3,581 | $341,000 | $110,000 | $231,000 |
| 2020 | $3,449 | $328,500 | $110,000 | $218,500 |
| 2019 | $3,478 | $331,200 | $110,000 | $221,200 |
| 2018 | $3,411 | $324,900 | $110,000 | $214,900 |
| 2017 | $3,162 | $301,100 | $95,000 | $206,100 |
| 2016 | $3,099 | $295,100 | $95,000 | $200,100 |
| 2015 | $3,027 | $288,300 | $90,000 | $198,300 |
| 2014 | $3,179 | $302,800 | $90,000 | $212,800 |
Source: Public Records
Map
Nearby Homes
- 4600 Davids Mill Dr
- 4817 Charlton Dr
- 1530 Jolliff Rd
- 1248 Jolliff Rd
- 1502 James Landing
- 1604 Tapgallant Quay
- 5533 Willow Lake Rd
- 1605 Tattinger Trail
- 4808 Oriole Dr
- 1532 Taylor Point Dr
- 4809 Sondej Ave
- 4809 Sondej Ave Unit D
- 1432 Pine Grove Ln
- 1808 Cully St
- 904 Flintfield Crescent
- MM Bayberry
- MM the Grove (Laurel)
- MM Myrtle II
- MM Rosewood 2
- MM Bayberry 2
- 1212 Manor View Ct
- 4601 Davids Mill Dr
- 4604 Davids Mill Dr
- 4609 Davids Mill Dr
- 1208 Manor View Ct
- 1255 Creekview Dr
- 4608 Davids Mill Dr
- 1209 Manor View Ct
- 1205 W Way Ct
- 1204 Manor View Ct
- 4613 Davids Mill Dr
- 1205 West Way Ct
- 1305 Creekview Dr
- 1201 West Way Ct
- 1256 Creekview Dr
- 1209 W Way Ct
- 1209 West Way Ct
- 1300 Glemmings Ct
- 4612 Davids Mill Dr
- 1205 Manor View Ct
Your Personal Tour Guide
Ask me questions while you tour the home.