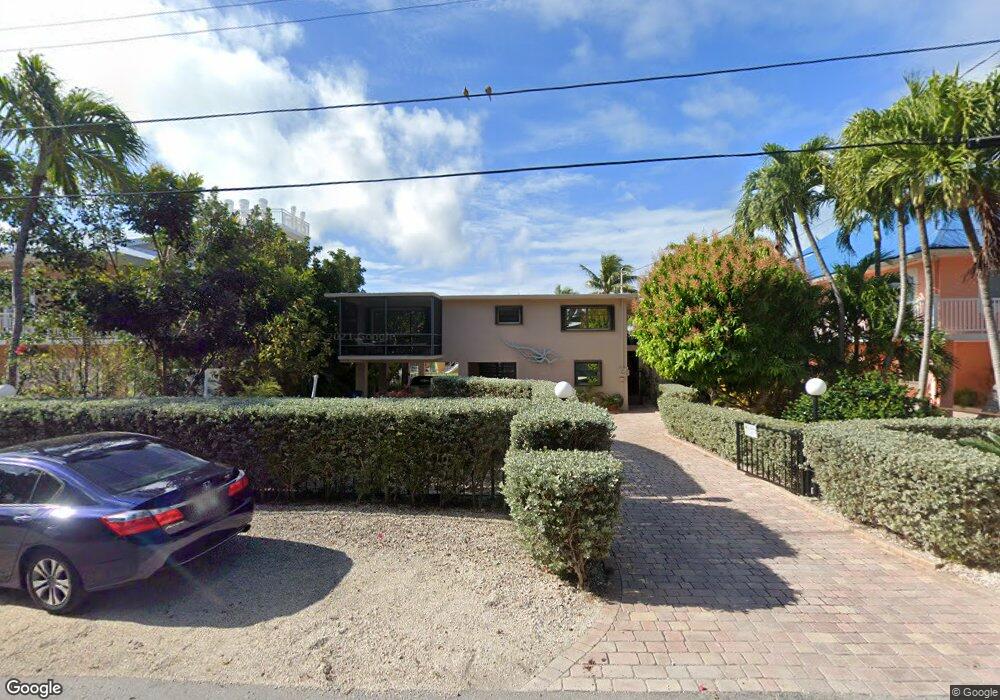
1216 Mockingbird Rd Key Largo, FL 33037
Estimated Value: $1,805,000 - $2,266,311
4
Beds
3
Baths
3,204
Sq Ft
$653/Sq Ft
Est. Value
About This Home
This home is located at 1216 Mockingbird Rd, Key Largo, FL 33037 and is currently estimated at $2,091,578, approximately $652 per square foot. 1216 Mockingbird Rd is a home located in Monroe County with nearby schools including Key Largo School, Coral Shores High School, and Ocean Studies Charter School.
Ownership History
Date
Name
Owned For
Owner Type
Purchase Details
Closed on
Jul 2, 2015
Sold by
Skeel Robert A and Skeel Sandra L
Bought by
Skeel Robert A and Skeel Sandra L
Current Estimated Value
Home Financials for this Owner
Home Financials are based on the most recent Mortgage that was taken out on this home.
Original Mortgage
$624,034
Outstanding Balance
$486,259
Interest Rate
4.08%
Mortgage Type
VA
Estimated Equity
$1,605,319
Purchase Details
Closed on
Feb 23, 2005
Sold by
Chacon Osmin and Chacon Maria
Bought by
Skeel Robert Allen and Skeel Sandra Lee
Home Financials for this Owner
Home Financials are based on the most recent Mortgage that was taken out on this home.
Original Mortgage
$650,000
Interest Rate
5.61%
Mortgage Type
Purchase Money Mortgage
Purchase Details
Closed on
Feb 1, 1970
Bought by
Skeel Robert A and Skeel Sandra L
Create a Home Valuation Report for This Property
The Home Valuation Report is an in-depth analysis detailing your home's value as well as a comparison with similar homes in the area
Home Values in the Area
Average Home Value in this Area
Purchase History
| Date | Buyer | Sale Price | Title Company |
|---|---|---|---|
| Skeel Robert A | -- | Title 365 | |
| Skeel Robert Allen | $910,000 | -- | |
| Skeel Robert A | $7,500 | -- |
Source: Public Records
Mortgage History
| Date | Status | Borrower | Loan Amount |
|---|---|---|---|
| Open | Skeel Robert A | $624,034 | |
| Closed | Skeel Robert Allen | $650,000 |
Source: Public Records
Tax History
| Year | Tax Paid | Tax Assessment Tax Assessment Total Assessment is a certain percentage of the fair market value that is determined by local assessors to be the total taxable value of land and additions on the property. | Land | Improvement |
|---|---|---|---|---|
| 2025 | $5,283 | $620,100 | -- | -- |
| 2024 | $5,283 | $602,624 | -- | -- |
| 2023 | $5,090 | $585,072 | $0 | $0 |
| 2022 | $4,805 | $568,032 | $0 | $0 |
| 2021 | $4,894 | $551,488 | $0 | $0 |
| 2020 | $4,865 | $543,874 | $0 | $0 |
| 2019 | $4,774 | $531,647 | $0 | $0 |
| 2018 | $4,772 | $521,735 | $0 | $0 |
| 2017 | $4,673 | $511,004 | $0 | $0 |
| 2016 | $4,736 | $500,494 | $0 | $0 |
| 2015 | $4,793 | $497,015 | $0 | $0 |
| 2014 | $4,892 | $493,070 | $0 | $0 |
Source: Public Records
Map
Nearby Homes
- 1218 Mockingbird Rd
- 917 Red Bird Rd
- 1202 Mockingbird Rd
- 1022 Dove Rd
- 946 S Topaz Ave
- 95351 Overseas Hwy
- 95325 Overseas Hwy
- 915 S 915 Emerald Dr
- 914 S Emerald Dr
- 918 S Ruby Dr
- 95480 & 90 Overseas Hwy
- 1032 Snapper Ln
- 95410 Overseas Hwy
- 1018 Snapper Ln
- 902 S Ruby Dr
- 1 Sunset Rd
- 1002 Snapper Ln
- 933 Lobster Ln
- 818 S Emerald Dr
- 814 S Emerald Dr
- 1214 Mockingbird Rd
- 1220 Mockingbird Rd Unit B
- 1220 Mockingbird Rd Unit A
- 1212 Mockingbird Rd
- 1217 Mockingbird Rd
- 1215 Mockingbird Rd
- 1219 Mockingbird Rd
- 1117 Heron Rd
- 918 Red Bird Rd Unit A
- 1119 Heron Rd
- 1213 Mockingbird Rd
- 916 Red Bird Rd
- 1210 Mockingbird Rd
- 1221 Mockingbird Rd
- 1115 Heron Rd
- 1121 Heron Rd
- 1211 Mockingbird Rd
- 1123 Heron Rd
- 1208 Mockingbird Rd
- 1223 Mockingbird Rd
Your Personal Tour Guide
Ask me questions while you tour the home.