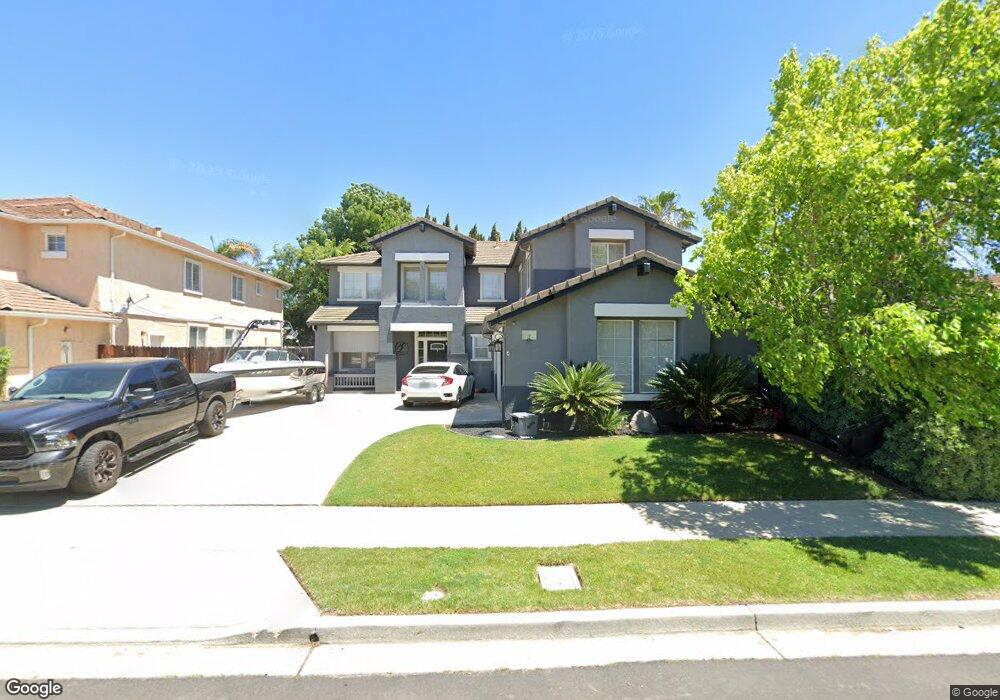
1216 Royal Ann Ct Brentwood, CA 94513
Estimated Value: $729,000 - $951,000
5
Beds
3
Baths
2,800
Sq Ft
$299/Sq Ft
Est. Value
About This Home
This home is located at 1216 Royal Ann Ct, Brentwood, CA 94513 and is currently estimated at $838,342, approximately $299 per square foot. 1216 Royal Ann Ct is a home located in Contra Costa County with nearby schools including Loma Vista Elementary School, William B. Bristow Middle School, and Heritage High School.
Ownership History
Date
Name
Owned For
Owner Type
Purchase Details
Closed on
Feb 18, 2009
Sold by
Gmac Mortgage Llc
Bought by
Farr Gregory R and Farr Marijah
Current Estimated Value
Home Financials for this Owner
Home Financials are based on the most recent Mortgage that was taken out on this home.
Original Mortgage
$240,000
Outstanding Balance
$150,160
Interest Rate
4.91%
Mortgage Type
Purchase Money Mortgage
Estimated Equity
$688,182
Purchase Details
Closed on
Sep 12, 2008
Sold by
Enomoto John E and Enomoto Hyung O
Bought by
Gmac Mortgage Llc
Purchase Details
Closed on
Oct 6, 2000
Sold by
Lp Homes #1 Llc
Bought by
Enomoto John E and Enomoto Hyung O
Home Financials for this Owner
Home Financials are based on the most recent Mortgage that was taken out on this home.
Original Mortgage
$284,000
Interest Rate
8.75%
Mortgage Type
Purchase Money Mortgage
Create a Home Valuation Report for This Property
The Home Valuation Report is an in-depth analysis detailing your home's value as well as a comparison with similar homes in the area
Home Values in the Area
Average Home Value in this Area
Purchase History
| Date | Buyer | Sale Price | Title Company |
|---|---|---|---|
| Farr Gregory R | $300,000 | First American Title Company | |
| Gmac Mortgage Llc | $382,500 | First American Title Ins Co | |
| Enomoto John E | $355,000 | First American Title Guarant |
Source: Public Records
Mortgage History
| Date | Status | Borrower | Loan Amount |
|---|---|---|---|
| Open | Farr Gregory R | $240,000 | |
| Previous Owner | Enomoto John E | $284,000 |
Source: Public Records
Tax History Compared to Growth
Tax History
| Year | Tax Paid | Tax Assessment Tax Assessment Total Assessment is a certain percentage of the fair market value that is determined by local assessors to be the total taxable value of land and additions on the property. | Land | Improvement |
|---|---|---|---|---|
| 2025 | $5,753 | $386,312 | $64,379 | $321,933 |
| 2024 | $5,674 | $378,738 | $63,117 | $315,621 |
| 2023 | $5,674 | $371,313 | $61,880 | $309,433 |
| 2022 | $5,597 | $364,033 | $60,667 | $303,366 |
| 2021 | $5,452 | $356,896 | $59,478 | $297,418 |
| 2019 | $5,442 | $346,313 | $57,715 | $288,598 |
| 2018 | $5,217 | $339,524 | $56,584 | $282,940 |
| 2017 | $5,225 | $332,868 | $55,475 | $277,393 |
| 2016 | $5,001 | $326,342 | $54,388 | $271,954 |
| 2015 | $4,939 | $321,441 | $53,572 | $267,869 |
| 2014 | $4,918 | $315,145 | $52,523 | $262,622 |
Source: Public Records
Map
Nearby Homes
- 420 Sand Creek Rd
- Lot 1 Saint James Ct
- 719 Monte Verde Ln
- 540 Sand Creek Rd
- 1162 Sea Breeze Ct
- 985 Chamomile Ln
- 927 Island Palm Way
- 894 Stonewood Dr
- 800 Minnesota Ave
- 1335 Willowwood Ct
- 1160 Orchid Dr
- 1065 Somersby Way
- 1067 Somersby Way
- 841 Fan Palm Ln
- 670 Rocky Creek Terrace
- 1347 Eisenhower Way
- 800 Queen Palm Ln
- 0 Sand Creek Rd Unit 41108080
- 0 Road 3
- 428 Trellis Way
- 1218 Royal Ann Ct
- 1233 Comice Pkwy
- 1235 Comice Pkwy
- 1231 Comice Pkwy
- 1223 Comice Pkwy
- 1220 Royal Ann Ct
- 1213 Royal Ann Ct
- 1237 Comice Pkwy
- 1211 Royal Ann Ct
- 1215 Royal Ann Ct
- 1239 Comice Pkwy
- 1217 Royal Ann Ct
- 679 Monte Verde Ln
- 677 Monte Verde Ln
- 681 Monte Verde Ln
- 1219 Royal Ann Ct
- 1204 Tartarian Ct
- 1202 Tartarian Ct
- 1241 Comice Pkwy
- 1206 Tartarian Ct