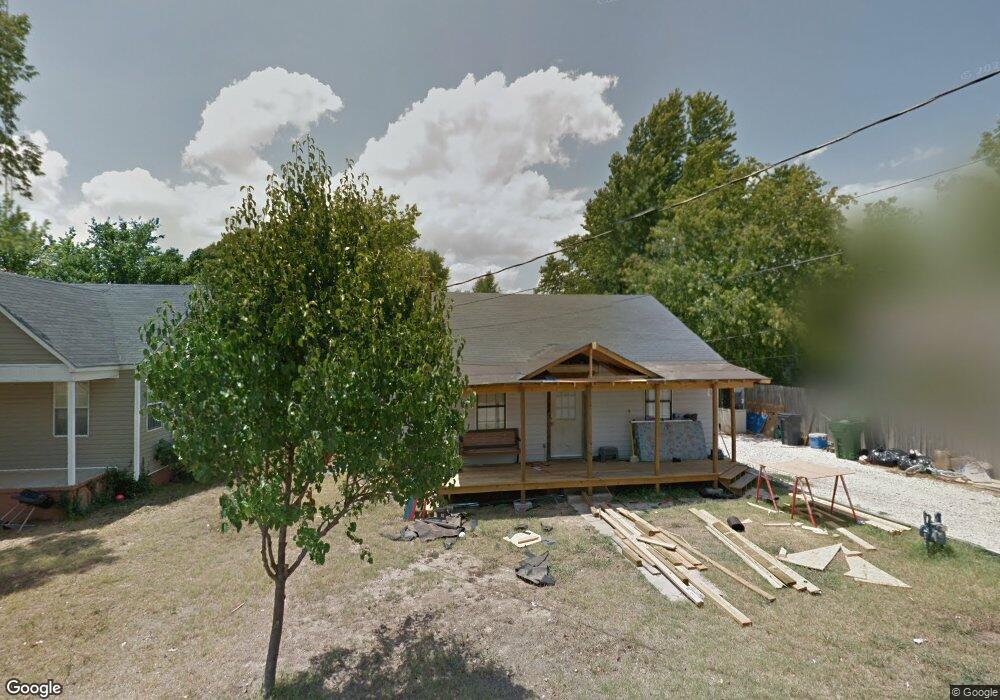
1216 S 3rd St Rogers, AR 72756
Estimated Value: $187,909 - $245,000
Studio
1
Bath
1,115
Sq Ft
$200/Sq Ft
Est. Value
About This Home
This home is located at 1216 S 3rd St, Rogers, AR 72756 and is currently estimated at $222,977, approximately $199 per square foot. 1216 S 3rd St is a home located in Benton County with nearby schools including Frank Tillery Elementary School, Lingle Middle School, and Rogers Heritage High School.
Ownership History
Date
Name
Owned For
Owner Type
Purchase Details
Closed on
Aug 18, 2023
Sold by
Lockman Nathan and Lockman Britt
Bought by
Lockman Nathan and Lockman Francine
Current Estimated Value
Purchase Details
Closed on
Jun 15, 2020
Sold by
Commissioner Of State Lands
Bought by
Lockman Nathan L and Lockman Britt
Purchase Details
Closed on
Sep 27, 2013
Sold by
Lockman Nathan
Bought by
Lockman Nathan and Lockman Britt
Purchase Details
Closed on
Apr 10, 2003
Bought by
Dod 04-10-2003
Purchase Details
Closed on
Jul 31, 1978
Bought by
Lockman
Create a Home Valuation Report for This Property
The Home Valuation Report is an in-depth analysis detailing your home's value as well as a comparison with similar homes in the area
Home Values in the Area
Average Home Value in this Area
Purchase History
| Date | Buyer | Sale Price | Title Company |
|---|---|---|---|
| Lockman Nathan | -- | None Listed On Document | |
| Lockman Nathan L | $449 | None Listed On Document | |
| Lockman Nathan | -- | None Available | |
| Dod 04-10-2003 | -- | -- | |
| Lockman | $14,000 | -- |
Source: Public Records
Tax History
| Year | Tax Paid | Tax Assessment Tax Assessment Total Assessment is a certain percentage of the fair market value that is determined by local assessors to be the total taxable value of land and additions on the property. | Land | Improvement |
|---|---|---|---|---|
| 2025 | $577 | $35,527 | $19,000 | $16,527 |
| 2024 | $537 | $35,527 | $19,000 | $16,527 |
| 2023 | $512 | $20,730 | $8,000 | $12,730 |
| 2022 | $134 | $20,730 | $8,000 | $12,730 |
| 2021 | $110 | $20,730 | $8,000 | $12,730 |
| 2020 | $87 | $8,420 | $2,400 | $6,020 |
| 2019 | $87 | $8,420 | $2,400 | $6,020 |
| 2018 | $112 | $8,420 | $2,400 | $6,020 |
| 2017 | $87 | $8,420 | $2,400 | $6,020 |
| 2016 | $87 | $8,420 | $2,400 | $6,020 |
| 2015 | $508 | $9,600 | $3,400 | $6,200 |
| 2014 | $508 | $9,600 | $3,400 | $6,200 |
Source: Public Records
Map
Nearby Homes
- 1203 S 3rd St
- 401 W Mulberry St
- 1511 S 5th St Unit 2
- 1013 S 1st St
- 217 W Birch St
- 1419 S Arkansas St
- 1023 S B St
- 803 S 1st St
- Lot 7 S 3rd St
- Lot 5 S 3rd St
- Lot 6 S 3rd St
- 707 S 7th St
- 906 W Holly St
- 525 S 6th St
- 501 S 7th St
- 805 W Lilac St
- 1014 S E St
- 1227 W Countrywood Cir
- 1013 S E St
- 630 W Poplar St
Your Personal Tour Guide
Ask me questions while you tour the home.