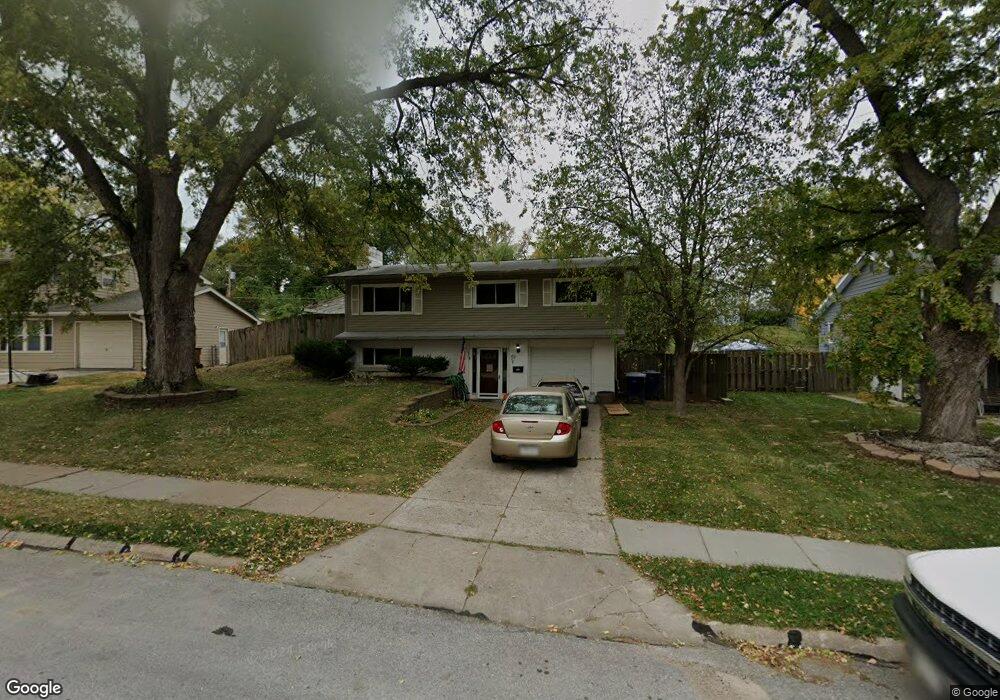
1216 Saint Andrews Rd Bellevue, NE 68005
Estimated Value: $236,000 - $256,000
3
Beds
1
Bath
1,036
Sq Ft
$236/Sq Ft
Est. Value
About This Home
This home is located at 1216 Saint Andrews Rd, Bellevue, NE 68005 and is currently estimated at $244,112, approximately $235 per square foot. 1216 Saint Andrews Rd is a home located in Sarpy County with nearby schools including Birchcrest Elementary School, Logan Fontenelle Middle School, and Bellevue East High School.
Ownership History
Date
Name
Owned For
Owner Type
Purchase Details
Closed on
Aug 10, 2022
Sold by
Bonen William R and Bonen Erin
Bought by
Hall Arial and Hall Thomas
Current Estimated Value
Home Financials for this Owner
Home Financials are based on the most recent Mortgage that was taken out on this home.
Original Mortgage
$217,021
Outstanding Balance
$207,132
Interest Rate
5.3%
Mortgage Type
New Conventional
Estimated Equity
$36,980
Purchase Details
Closed on
Sep 18, 2009
Sold by
Bonen William R and Adams Erin
Bought by
Bonen William R
Home Financials for this Owner
Home Financials are based on the most recent Mortgage that was taken out on this home.
Original Mortgage
$129,548
Interest Rate
4.25%
Purchase Details
Closed on
Nov 17, 2007
Sold by
Bennett Linda L
Bought by
Bonen William R
Home Financials for this Owner
Home Financials are based on the most recent Mortgage that was taken out on this home.
Original Mortgage
$123,856
Interest Rate
6.42%
Create a Home Valuation Report for This Property
The Home Valuation Report is an in-depth analysis detailing your home's value as well as a comparison with similar homes in the area
Home Values in the Area
Average Home Value in this Area
Purchase History
| Date | Buyer | Sale Price | Title Company |
|---|---|---|---|
| Hall Arial | $222,000 | None Listed On Document | |
| Bonen William R | -- | Nations Title Agency Inc | |
| Bonen William R | $120,000 | Nlta |
Source: Public Records
Mortgage History
| Date | Status | Borrower | Loan Amount |
|---|---|---|---|
| Open | Hall Arial | $217,021 | |
| Previous Owner | Bonen William R | $129,548 | |
| Previous Owner | Bonen William R | $123,856 |
Source: Public Records
Tax History Compared to Growth
Tax History
| Year | Tax Paid | Tax Assessment Tax Assessment Total Assessment is a certain percentage of the fair market value that is determined by local assessors to be the total taxable value of land and additions on the property. | Land | Improvement |
|---|---|---|---|---|
| 2025 | $3,416 | $202,863 | $38,000 | $164,863 |
| 2024 | $3,618 | $194,591 | $34,000 | $160,591 |
| 2023 | $3,618 | $171,362 | $30,000 | $141,362 |
| 2022 | $3,460 | $160,786 | $27,000 | $133,786 |
| 2021 | $3,370 | $154,939 | $27,000 | $127,939 |
| 2020 | $3,178 | $145,648 | $21,000 | $124,648 |
| 2019 | $2,939 | $135,505 | $21,000 | $114,505 |
| 2018 | $2,746 | $130,024 | $21,000 | $109,024 |
| 2017 | $2,621 | $123,264 | $21,000 | $102,264 |
| 2016 | $2,494 | $119,899 | $21,000 | $98,899 |
| 2015 | $2,455 | $118,678 | $21,000 | $97,678 |
| 2014 | $2,438 | $117,105 | $21,000 | $96,105 |
| 2012 | -- | $115,779 | $21,000 | $94,779 |
Source: Public Records
Map
Nearby Homes
- 20.74 Acres
- 1302 Wilroy Rd Unit 1
- 1101 Potter Rd
- 1206 Skyview Dr
- 1101 Marian Ave
- 1212 W 16th Ave
- 1509 Brenda Dr
- 910 Lemay Dr
- 2113 Twinridge Dr
- 2203 Lloyd St
- 208 Sandi Ct
- 1511 Lorraine Ave
- 304 Marian Ave
- 2208 Greensboro Ave
- 901 Brenton Ave
- 1505 Mildred Ave
- 2108 Randall Dr
- 2212 Greensboro Ave
- 2303 Lloyd St
- 1219 Robin Dr
- 1216 St Andrews Rd
- 1214 St Andrews Rd
- 1214 Saint Andrews Rd
- 1218 St Andrews Rd
- 1218 Saint Andrews Rd
- 1215 Wilroy Rd
- 1217 Wilroy Rd
- 1146 Saint Andrews Rd
- 0 Saint Andrews Rd
- 1220 Saint Andrews Rd
- 1215 St Andrews Rd
- 1213 Wilroy Rd
- 1147 St Andrews Rd
- 1215 Saint Andrews Rd
- 1145 St Andrews Rd
- 1147 Saint Andrews Rd
- 1219 Wilroy Rd
- 1144 Saint Andrews Rd
- 1145 Saint Andrews Rd
- 1211 Wilroy Rd