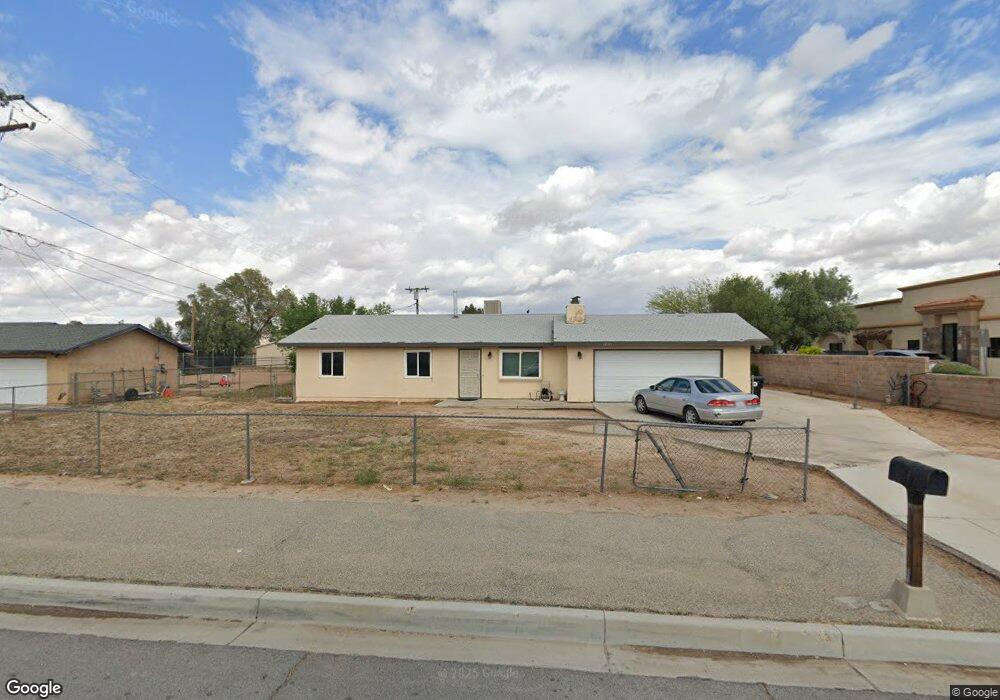
12165 Navajo Rd Apple Valley, CA 92308
High Desert NeighborhoodEstimated Value: $290,098 - $351,000
3
Beds
2
Baths
1,644
Sq Ft
$195/Sq Ft
Est. Value
About This Home
This home is located at 12165 Navajo Rd, Apple Valley, CA 92308 and is currently estimated at $320,549, approximately $194 per square foot. 12165 Navajo Rd is a home located in San Bernardino County with nearby schools including Sandia Elementary School and Apple Valley High School.
Ownership History
Date
Name
Owned For
Owner Type
Purchase Details
Closed on
Nov 13, 2017
Sold by
Avd 3 Land Llc
Bought by
Tan Jason Hui and Sun Sophia P
Current Estimated Value
Purchase Details
Closed on
May 17, 2017
Sold by
Kim Samuel
Bought by
Avd 3 Land Llc
Purchase Details
Closed on
Jan 23, 2006
Sold by
Jue Investment Partnership
Bought by
Kim Samuel Il
Home Financials for this Owner
Home Financials are based on the most recent Mortgage that was taken out on this home.
Original Mortgage
$220,000
Interest Rate
6.29%
Mortgage Type
New Conventional
Purchase Details
Closed on
Jan 3, 1996
Sold by
Drury Maureen
Bought by
Jue Investment Partnership
Purchase Details
Closed on
Jan 2, 1996
Sold by
Birrell Donald
Bought by
Lew George and Jue Irrevocable Grandchildrens
Purchase Details
Closed on
Jul 24, 1995
Sold by
Jue Investment Partnership
Bought by
Drury Maureen and Jue Vincent
Create a Home Valuation Report for This Property
The Home Valuation Report is an in-depth analysis detailing your home's value as well as a comparison with similar homes in the area
Home Values in the Area
Average Home Value in this Area
Purchase History
| Date | Buyer | Sale Price | Title Company |
|---|---|---|---|
| Tan Jason Hui | $167,000 | Ticor Title Riverside | |
| Avd 3 Land Llc | -- | None Available | |
| Kim Samuel Il | $275,000 | Chicago Title Company | |
| Jue Investment Partnership | -- | -- | |
| Lew George | -- | -- | |
| Drury Maureen | -- | -- |
Source: Public Records
Mortgage History
| Date | Status | Borrower | Loan Amount |
|---|---|---|---|
| Previous Owner | Kim Samuel Il | $220,000 |
Source: Public Records
Tax History Compared to Growth
Tax History
| Year | Tax Paid | Tax Assessment Tax Assessment Total Assessment is a certain percentage of the fair market value that is determined by local assessors to be the total taxable value of land and additions on the property. | Land | Improvement |
|---|---|---|---|---|
| 2025 | $2,271 | $189,903 | $85,336 | $104,567 |
| 2024 | $2,271 | $186,180 | $83,663 | $102,517 |
| 2023 | $2,250 | $182,530 | $82,023 | $100,507 |
| 2022 | $2,215 | $178,951 | $80,415 | $98,536 |
| 2021 | $2,165 | $175,442 | $78,838 | $96,604 |
| 2020 | $2,139 | $173,643 | $78,030 | $95,613 |
| 2019 | $2,480 | $170,238 | $76,500 | $93,738 |
| 2018 | $2,048 | $166,900 | $75,000 | $91,900 |
| 2017 | $2,582 | $215,900 | $60,000 | $155,900 |
| 2016 | $2,304 | $196,200 | $54,500 | $141,700 |
| 2015 | $2,119 | $180,000 | $50,000 | $130,000 |
| 2014 | $2,170 | $176,600 | $118,800 | $57,800 |
Source: Public Records
Map
Nearby Homes
- 12196 Toltec Dr
- 21650 Bear Valley Rd
- 12358 Sioux Rd
- 0 Sioux Rd
- 11995 Jamacha Rd
- 12409 Pawnee Rd
- 21336 Laguna Rd
- 0 Pahute Rd Unit HD25164188
- 21512 Pahute Rd
- 22035 Pahute Rd
- 0 Sandia Rd Unit HD23115555
- 21215 Multnomah Rd
- 21275 Pocomoke Ct
- 21621 Sandia Rd Unit 138
- 21621 Sandia Rd Unit 59
- 21621 Sandia Rd Unit 17
- 21621 Sandia Rd Unit 130
- 21621 Sandia Rd Unit 159
- 21621 Sandia Rd Unit 57
- 21621 Sandia Rd Unit 71
- 12167 Navajo Rd
- 12164 Toltec Dr
- 12180 Toltec Dr
- 12191 Navajo Rd
- 21718 Bear Valley Rd
- 21680 Bear Valley Rd
- 21660 Bear Valley Rd Unit F-5
- 21660 Bear Valley Rd Unit F-1
- 21660 Bear Valley Rd Unit F2
- 12163 Toltec Dr
- 12141 Toltec Dr
- 12183 Toltec Dr
- 12193 Toltec Dr
- 12245 Navajo Rd
- 12144 Toltec Dr
- 21620 Bear Valley Rd
- 21620 Bear Valley Rd Unit D-1
- 21620 Bear Valley Rd Unit 1 & 6
- 21620 Bear Valley Rd Unit D3&D4
- 21620 Bear Valley Rd Unit 2