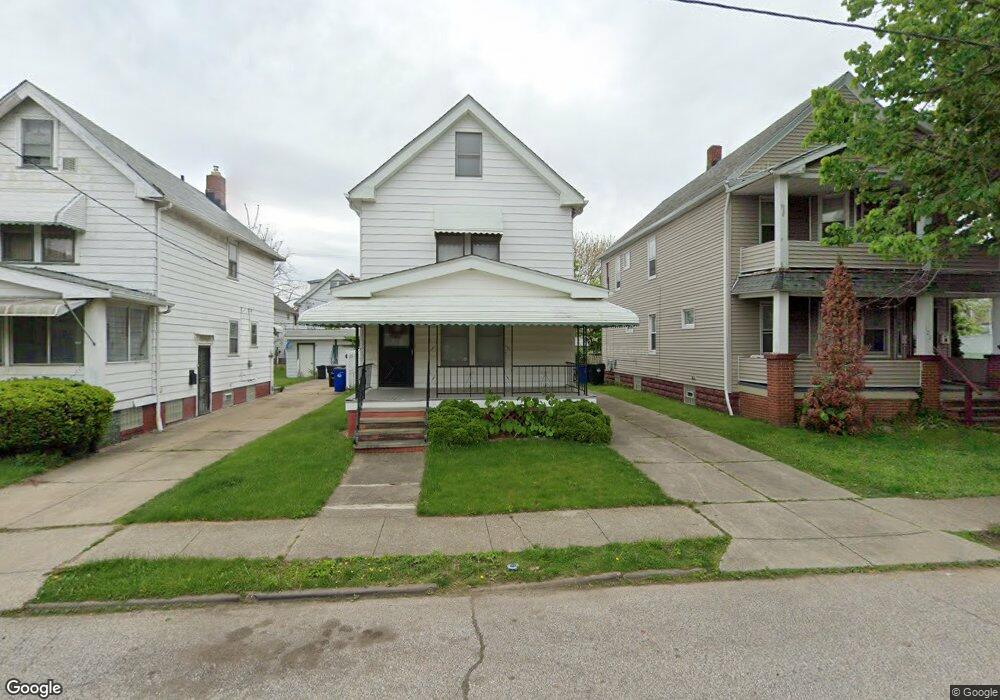
1217 E 172nd St Cleveland, OH 44119
North Collinwood NeighborhoodEstimated Value: $85,545 - $148,000
3
Beds
2
Baths
1,008
Sq Ft
$107/Sq Ft
Est. Value
About This Home
This home is located at 1217 E 172nd St, Cleveland, OH 44119 and is currently estimated at $107,636, approximately $106 per square foot. 1217 E 172nd St is a home located in Cuyahoga County with nearby schools including Lakeshore Intergenerational School, Imagine Bella Academy of Excellence, and Noble Academy-Cleveland.
Ownership History
Date
Name
Owned For
Owner Type
Purchase Details
Closed on
Jul 10, 2021
Sold by
Toth Christopher and Toth Meredith Hope
Bought by
Cleveland Re Holdings Llc
Current Estimated Value
Purchase Details
Closed on
Jun 3, 2021
Sold by
Toth Christopher
Bought by
Toth Meredith Hope and Toth Christopher
Purchase Details
Closed on
Oct 20, 2020
Sold by
Huckaby Kimberly and Huckaby Kimberly A
Bought by
Toth Christopher
Purchase Details
Closed on
Oct 31, 2016
Sold by
Huckaby Kimberly and Huckaby Peggie
Bought by
Kuckaby Kimberly
Purchase Details
Closed on
Jun 3, 2016
Sold by
Huckaby Peggie A
Bought by
Huckaby Peggie A and Huckaby Kimberly A
Purchase Details
Closed on
May 20, 2002
Sold by
Henderson Johnnie M
Bought by
Huckaby Peggie A
Purchase Details
Closed on
Jun 22, 1990
Sold by
Boger Josephine and Boger Janet
Bought by
Huckaby Peggy A
Purchase Details
Closed on
Jan 1, 1975
Bought by
Boger Josephine and Boger Janet
Create a Home Valuation Report for This Property
The Home Valuation Report is an in-depth analysis detailing your home's value as well as a comparison with similar homes in the area
Home Values in the Area
Average Home Value in this Area
Purchase History
| Date | Buyer | Sale Price | Title Company |
|---|---|---|---|
| Cleveland Re Holdings Llc | -- | Accommodation | |
| Toth Meredith Hope | -- | Titleco Title Agency Ltd | |
| Toth Christopher | $32,000 | Titleco Title Agency | |
| Kuckaby Kimberly | -- | None Available | |
| Huckaby Peggie A | -- | Attorney | |
| Huckaby Peggie A | -- | Equity Title Agency Inc | |
| Huckaby Peggy A | $40,000 | -- | |
| Boger Josephine | -- | -- |
Source: Public Records
Tax History
| Year | Tax Paid | Tax Assessment Tax Assessment Total Assessment is a certain percentage of the fair market value that is determined by local assessors to be the total taxable value of land and additions on the property. | Land | Improvement |
|---|---|---|---|---|
| 2024 | $1,325 | $19,810 | $4,655 | $15,155 |
| 2023 | $869 | $11,210 | $3,260 | $7,950 |
| 2022 | $864 | $11,200 | $3,255 | $7,945 |
| 2021 | $837 | $11,200 | $3,260 | $7,950 |
| 2020 | $1,122 | $12,990 | $2,870 | $10,120 |
| 2019 | $1,037 | $37,100 | $8,200 | $28,900 |
| 2018 | $1,034 | $12,990 | $2,870 | $10,120 |
| 2017 | $1,106 | $13,410 | $2,730 | $10,680 |
| 2016 | $381 | $13,410 | $2,730 | $10,680 |
| 2015 | $4,227 | $13,410 | $2,730 | $10,680 |
| 2014 | $2,819 | $15,400 | $3,150 | $12,250 |
Source: Public Records
Map
Nearby Homes
- 1193 E 172nd St
- 1241 E 173rd St
- 17216 Grovewood Ave
- 16918 Grovewood Ave
- 1239 E 168th St
- 1140 E 169th St
- 1077 E 169th St
- 1113 E 177th St
- 16204 Arcade Ave
- 16110 Huntmere Ave
- 983 E 179th St
- 15901 Pythias Ave
- 17633 Wildwood Ln Unit 311
- 17639 Wildwood Ln Unit 17639
- 1426 E 175th St
- 1357 E 170th St
- 1476 Clermont Rd
- 18526 Underwood Ave
- 1445 E 172nd St
- 17645 Lakeport Ave
- 1213 E 172nd St
- 1221 E 172nd St
- 1221 E 172nd St Unit 1/DN
- 1221 E 172nd St Unit 2
- 1227 E 172nd St
- 1216 E 173rd St
- 1212 E 173rd St
- 1220 E 173rd St
- 1224 E 173rd St
- 1208 E 173rd St
- 1229 E 172nd St
- 1201 E 172nd St
- 1214 E 172nd St
- 1218 E 172nd St
- 1228 E 173rd St
- 1204 E 173rd St
- 1204 E 173rd St Unit UP
- 1204 E 173rd St Unit down
- 1222 E 172nd St
- 1210 E 172nd St
Your Personal Tour Guide
Ask me questions while you tour the home.