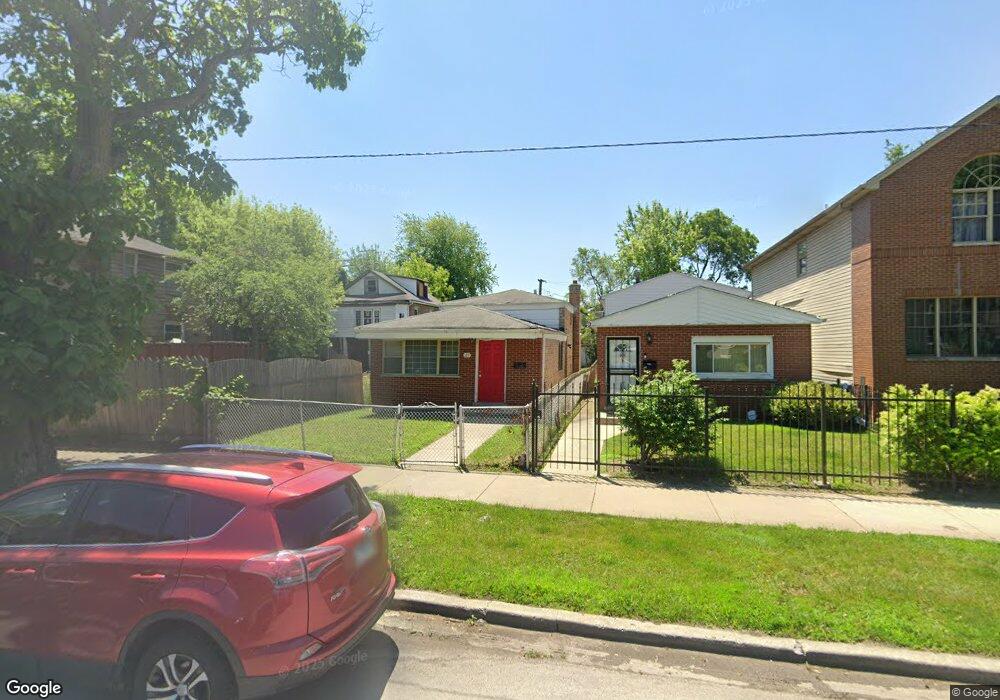
1217 E 72nd Place Chicago, IL 60619
Grand Crossing NeighborhoodEstimated Value: $158,140 - $234,000
4
Beds
2
Baths
1,600
Sq Ft
$123/Sq Ft
Est. Value
About This Home
This home is located at 1217 E 72nd Place, Chicago, IL 60619 and is currently estimated at $197,535, approximately $123 per square foot. 1217 E 72nd Place is a home located in Cook County with nearby schools including Revere Elementary School, Gary Comer College Prep Middle School, and Gary Comer College Prep.
Ownership History
Date
Name
Owned For
Owner Type
Purchase Details
Closed on
May 13, 2003
Sold by
Ingomar Lp
Bought by
Omene Franklin
Current Estimated Value
Purchase Details
Closed on
May 13, 2002
Sold by
Roby Blair E
Bought by
Ingomar Lp
Purchase Details
Closed on
Nov 26, 1999
Sold by
Baciu Petru
Bought by
Roby Blair
Home Financials for this Owner
Home Financials are based on the most recent Mortgage that was taken out on this home.
Original Mortgage
$57,000
Interest Rate
11.5%
Purchase Details
Closed on
Oct 22, 1998
Sold by
The Bank Of New York
Bought by
Baciu Petru
Purchase Details
Closed on
Aug 10, 1994
Sold by
Midwest Real Estate Investment Company
Bought by
Rollerson Alisa Y
Home Financials for this Owner
Home Financials are based on the most recent Mortgage that was taken out on this home.
Original Mortgage
$37,000
Interest Rate
9.2%
Purchase Details
Closed on
Jun 20, 1992
Sold by
Midwest Real Estate Investment Company
Bought by
Rollerson Harvey and Rollerson Alisa
Create a Home Valuation Report for This Property
The Home Valuation Report is an in-depth analysis detailing your home's value as well as a comparison with similar homes in the area
Home Values in the Area
Average Home Value in this Area
Purchase History
| Date | Buyer | Sale Price | Title Company |
|---|---|---|---|
| Omene Franklin | $63,000 | -- | |
| Omene Franklin | $63,000 | -- | |
| Ingomar Lp | -- | -- | |
| Roby Blair | $76,000 | Chicago Title Insurance Co | |
| Baciu Petru | $27,000 | -- | |
| Rollerson Alisa Y | $21,000 | North Star Title | |
| Rollerson Harvey | -- | -- |
Source: Public Records
Mortgage History
| Date | Status | Borrower | Loan Amount |
|---|---|---|---|
| Previous Owner | Roby Blair | $57,000 | |
| Previous Owner | Rollerson Alisa Y | $37,000 | |
| Closed | Roby Blair | $19,000 |
Source: Public Records
Tax History
| Year | Tax Paid | Tax Assessment Tax Assessment Total Assessment is a certain percentage of the fair market value that is determined by local assessors to be the total taxable value of land and additions on the property. | Land | Improvement |
|---|---|---|---|---|
| 2025 | $1,233 | $7,801 | $2,813 | $4,988 |
| 2024 | $1,233 | $7,801 | $2,813 | $4,988 |
| 2023 | $1,198 | $5,825 | $3,906 | $1,919 |
| 2022 | $1,198 | $5,825 | $3,906 | $1,919 |
| 2021 | $1,171 | $5,825 | $3,906 | $1,919 |
| 2020 | $2,716 | $12,193 | $3,437 | $8,756 |
| 2019 | $2,692 | $13,399 | $3,437 | $9,962 |
| 2018 | $2,647 | $13,399 | $3,437 | $9,962 |
| 2017 | $2,812 | $13,063 | $3,125 | $9,938 |
| 2016 | $2,616 | $13,063 | $3,125 | $9,938 |
| 2015 | $2,394 | $13,063 | $3,125 | $9,938 |
| 2014 | $2,207 | $11,895 | $2,500 | $9,395 |
| 2013 | $2,163 | $11,895 | $2,500 | $9,395 |
Source: Public Records
Map
Nearby Homes
- 7225 S Woodlawn Ave
- 7316 S Woodlawn Ave
- 7326 S Woodlawn Ave
- 1301 E 73rd St
- 1225 E 71st Place
- 7135 S Woodlawn Ave
- 7337 S University Ave
- 1310 E 72nd St
- 7146 S University Ave
- 1301 E 71st Place Unit 2
- 1336 E 73rd St
- 7125 S University Ave
- 7335 S Greenwood Ave
- 1229 E 71st St
- 7356 S Kenwood Ave
- 1415 E 71st Place
- 1401 E 71st Place
- 7435 S Kimbark Ave
- 7022 S Kimbark Ave
- 7319 S Dante Ave
- 1217 E 72nd Place Unit 1
- 1215 E 72nd Place
- 1215 E 72nd Place Unit 1
- 1215 E 72nd Place Unit 3
- 1211 E 72nd Place
- 1219 E 72nd Place
- 7239 S Woodlawn Ave
- 7239 S Woodlawn Ave Unit 2
- 7239 S Woodlawn Ave Unit 1
- 7239 S Woodlawn Ave
- 7235 S Woodlawn Ave Unit 1
- 7241 S Woodlawn Ave Unit 2
- 7245 S Woodlawn Ave
- 1216 E 73rd St
- 1216 E 72nd Place
- 1214 E 73rd St
- 1214 E 72nd Place
- 1218 E 72nd Place
- 1212 E 72nd Place
- 1222 E 72nd Place
Your Personal Tour Guide
Ask me questions while you tour the home.