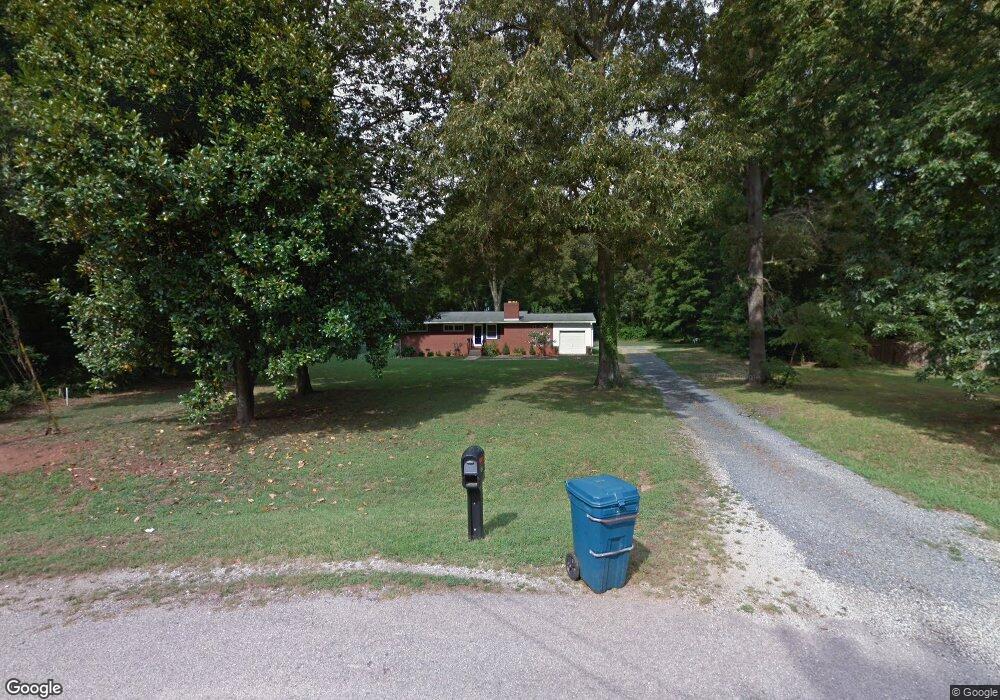
1217 Mirror Park Dr Salisbury, NC 28146
Estimated Value: $222,000 - $251,000
3
Beds
1
Bath
1,275
Sq Ft
$184/Sq Ft
Est. Value
About This Home
This home is located at 1217 Mirror Park Dr, Salisbury, NC 28146 and is currently estimated at $235,116, approximately $184 per square foot. 1217 Mirror Park Dr is a home located in Rowan County with nearby schools including Granite Quarry Elementary School, Charles C Erwin Middle School, and East Rowan High School.
Ownership History
Date
Name
Owned For
Owner Type
Purchase Details
Closed on
May 7, 2009
Sold by
Hsbc Bank Usa Na
Bought by
Scoggins Ronald and Scoggins Eugenia
Current Estimated Value
Home Financials for this Owner
Home Financials are based on the most recent Mortgage that was taken out on this home.
Original Mortgage
$48,000
Outstanding Balance
$30,766
Interest Rate
5.12%
Mortgage Type
Purchase Money Mortgage
Estimated Equity
$204,350
Purchase Details
Closed on
Oct 27, 2008
Sold by
Carter Karen D
Bought by
Hsbc Bank Usa Na
Purchase Details
Closed on
Jul 8, 2005
Sold by
Byers Warlick L and Byers Jennifer D
Bought by
Carter Karen D
Home Financials for this Owner
Home Financials are based on the most recent Mortgage that was taken out on this home.
Original Mortgage
$79,200
Interest Rate
9.24%
Mortgage Type
Fannie Mae Freddie Mac
Purchase Details
Closed on
Dec 29, 2004
Sold by
Waddell Nickholas A and Waddell Debra L
Bought by
Byers Warlick L
Create a Home Valuation Report for This Property
The Home Valuation Report is an in-depth analysis detailing your home's value as well as a comparison with similar homes in the area
Home Values in the Area
Average Home Value in this Area
Purchase History
We collect this data history from publicly available records. To have your information removed, we recommend requesting removal directly through your county’s website.
| Date | Buyer | Sale Price | Title Company |
|---|---|---|---|
| Scoggins Ronald | $60,000 | None Available | |
| Hsbc Bank Usa Na | $56,730 | None Available | |
| Carter Karen D | $88,000 | -- | |
| Byers Warlick L | $61,905 | -- |
Source: Public Records
Mortgage History
We collect this data history from publicly available records. To have your information removed, we recommend requesting removal directly through your county’s website.
| Date | Status | Borrower | Loan Amount |
|---|---|---|---|
| Open | Scoggins Ronald | $48,000 | |
| Previous Owner | Carter Karen D | $79,200 |
Source: Public Records
Tax History
| Year | Tax Paid | Tax Assessment Tax Assessment Total Assessment is a certain percentage of the fair market value that is determined by local assessors to be the total taxable value of land and additions on the property. | Land | Improvement |
|---|---|---|---|---|
| 2025 | $2,065 | $172,699 | $27,600 | $145,099 |
| 2024 | $2,065 | $172,699 | $27,600 | $145,099 |
| 2023 | $2,065 | $172,699 | $27,600 | $145,099 |
| 2022 | $1,474 | $107,042 | $23,000 | $84,042 |
| 2021 | $1,474 | $107,042 | $23,000 | $84,042 |
| 2020 | $1,474 | $107,042 | $23,000 | $84,042 |
| 2019 | $1,474 | $107,042 | $23,000 | $84,042 |
| 2018 | $1,249 | $91,954 | $23,000 | $68,954 |
| 2017 | $1,243 | $91,954 | $23,000 | $68,954 |
| 2016 | $1,209 | $91,954 | $23,000 | $68,954 |
| 2015 | $1,216 | $91,954 | $23,000 | $68,954 |
| 2014 | $1,183 | $90,553 | $23,000 | $67,553 |
Source: Public Records
Map
Nearby Homes
- 1207 Oak Haven Dr
- 1001 Faith Rd
- 429 Oak Brook Dr
- 507 Oak Brook Dr
- 321 Stone Ridge Dr
- 407 Oak Forest Ln
- 1425 Faith Rd
- 609 Oak Forest Ln
- 106 Mist Valley Dr
- 2404 Wedgewood Dr
- 2540 Jake Alexander Blvd S
- 2530 Jake Alexander Blvd S Unit 1
- 120 Brittany Way
- 106 Birmingham Place
- 1203 Edgewater Ct
- 2403 E Innes St
- 453 Pepperstone Dr
- 818 Pine Hill Dr
- 115 River Birch Dr
- 412 Garner Dr
- 1221 Mirror Park Dr
- 104 Cross Dr
- 1215 Mirror Park Dr
- 1230 Dogwood Ln
- 123 Cross Dr
- 127 Cross Dr
- 1226 Dogwood Ln
- 0 Cross Dr
- 1225 Mirror Park Dr
- 119 Cross Dr
- 1229 Mirror Park Dr
- 1235 Mirror Park Dr
- 1213 Mirror Park Dr
- 1218 Dogwood Ln
- 1208 Mirror Park Dr
- 515 Mirror Lake Rd
- 137 Cross Dr
- 1210 Dogwood Ln
- 1212 Mirror Park Dr
- 201 Cross Dr
Your Personal Tour Guide
Ask me questions while you tour the home.