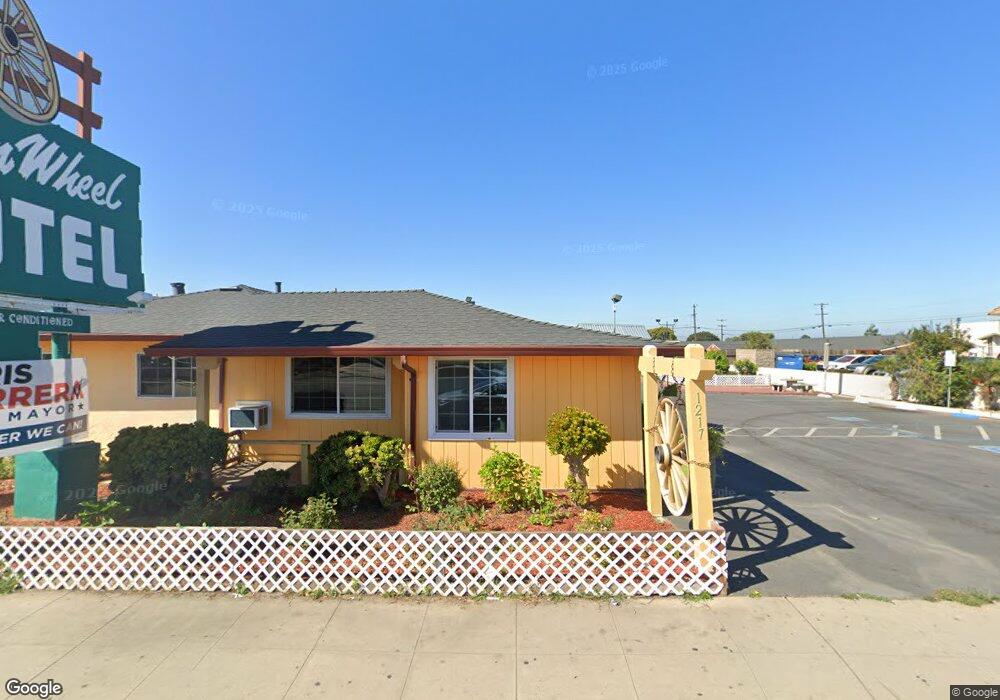
1217 N Main St Salinas, CA 93906
Northridge NeighborhoodEstimated Value: $2,641,170
35
Beds
36
Baths
6,852
Sq Ft
$385/Sq Ft
Est. Value
About This Home
This home is located at 1217 N Main St, Salinas, CA 93906 and is currently estimated at $2,641,170, approximately $385 per square foot. 1217 N Main St is a home located in Monterey County with nearby schools including Henry F. Kammann Elementary School, Boronda Meadows Elementary School, and Harden Middle School.
Ownership History
Date
Name
Owned For
Owner Type
Purchase Details
Closed on
Mar 26, 2013
Sold by
Choi Chu Woong
Bought by
Lad Hasmukhbhai J and Lad Pannaben H
Current Estimated Value
Home Financials for this Owner
Home Financials are based on the most recent Mortgage that was taken out on this home.
Original Mortgage
$730,000
Outstanding Balance
$442,761
Interest Rate
3.49%
Mortgage Type
Commercial
Estimated Equity
$2,198,409
Purchase Details
Closed on
Mar 24, 2012
Sold by
Choi Chu Woong
Bought by
Choi Chu Woong
Purchase Details
Closed on
Jan 25, 2008
Sold by
Choi Chu Woong and Choi Young Sook
Bought by
Choi Chu Woong and Choi Young Sook
Purchase Details
Closed on
Jun 29, 1999
Sold by
Jang Chu Soon
Bought by
Choi Chu Woong and Choi Young Sook
Home Financials for this Owner
Home Financials are based on the most recent Mortgage that was taken out on this home.
Original Mortgage
$700,000
Interest Rate
7.51%
Mortgage Type
Seller Take Back
Purchase Details
Closed on
Apr 19, 1999
Sold by
Jang Chu Soon
Bought by
Jang Chu Soon
Create a Home Valuation Report for This Property
The Home Valuation Report is an in-depth analysis detailing your home's value as well as a comparison with similar homes in the area
Home Values in the Area
Average Home Value in this Area
Purchase History
| Date | Buyer | Sale Price | Title Company |
|---|---|---|---|
| Lad Hasmukhbhai J | $1,050,000 | Chicago Title Company | |
| Choi Chu Woong | -- | None Available | |
| Choi Chu Woong | -- | None Available | |
| Choi Chu Woong | -- | None Available | |
| Choi Chu Woong | -- | None Available | |
| Choi Chu Woong | $700,000 | First American Title | |
| Jang Chu Soon | -- | -- |
Source: Public Records
Mortgage History
| Date | Status | Borrower | Loan Amount |
|---|---|---|---|
| Open | Lad Hasmukhbhai J | $730,000 | |
| Previous Owner | Choi Chu Woong | $700,000 |
Source: Public Records
Tax History
| Year | Tax Paid | Tax Assessment Tax Assessment Total Assessment is a certain percentage of the fair market value that is determined by local assessors to be the total taxable value of land and additions on the property. | Land | Improvement |
|---|---|---|---|---|
| 2025 | $15,089 | $1,292,987 | $861,994 | $430,993 |
| 2024 | $15,089 | $1,267,636 | $845,093 | $422,543 |
| 2023 | $14,586 | $1,242,781 | $828,523 | $414,258 |
| 2022 | $14,047 | $1,218,414 | $812,278 | $406,136 |
| 2021 | $13,494 | $1,194,524 | $796,351 | $398,173 |
| 2020 | $13,125 | $1,182,277 | $788,186 | $394,091 |
| 2019 | $13,030 | $1,159,096 | $772,732 | $386,364 |
| 2018 | $12,869 | $1,136,370 | $757,581 | $378,789 |
| 2017 | $12,873 | $1,114,089 | $742,727 | $371,362 |
| 2016 | $12,879 | $1,092,245 | $728,164 | $364,081 |
| 2015 | $12,988 | $1,075,840 | $717,227 | $358,613 |
| 2014 | $12,128 | $1,054,767 | $703,178 | $351,589 |
Source: Public Records
Map
Nearby Homes
- 427 W Laurel Dr Unit A
- 1170 Tyler St
- 336 Rainier Dr
- 208 Diablo Dr
- 217 Iris Dr
- 323 Chaparral St
- 344 Pueblo Dr
- 1421 Amador Cir
- 730 N Main St
- 1445 Amador Cir
- 15 Saint Francis Way
- 530 Inca Way
- 24 Saint Francis Way
- 1515 Aragon Cir
- 1103 Sherman Dr
- 1075 Sherman Dr
- 1489 Lassen Ave
- 1588 Cherokee Dr
- 1518 Duran Cir
- 1520 Ebro Cir
- 1216 Huntington St
- 1212 Huntington St
- 1218 Huntington St
- 1208 Huntington St
- 23 Rochex Ave
- 1202 Huntington St
- 1213 Huntington St
- 1250 N Main St
- 1209 Huntington St
- 1217 Huntington St
- 1252 N Main St
- 1205 Huntington St
- 101 Rochex Ave
- 1260 N Main St
- 114 W Laurel Dr
- 100 Rochex Ave
- 1274 N Main St
- 108 Rochex Ave
- 1214 Claremont St
- 112 Rochex Ave
Your Personal Tour Guide
Ask me questions while you tour the home.