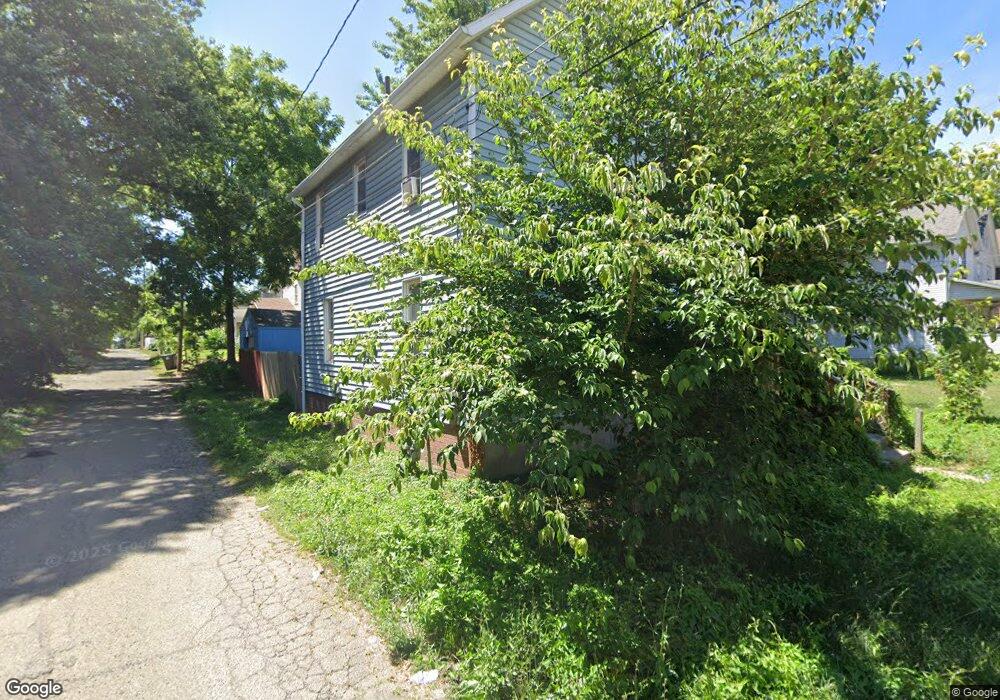
1217 Rowland Ave NE Canton, OH 44705
Gibbs Area NeighborhoodEstimated Value: $65,000 - $105,000
3
Beds
1
Bath
1,326
Sq Ft
$62/Sq Ft
Est. Value
About This Home
This home is located at 1217 Rowland Ave NE, Canton, OH 44705 and is currently estimated at $82,318, approximately $62 per square foot. 1217 Rowland Ave NE is a home located in Stark County with nearby schools including Early Learning Center @ Schreiber, Gibbs Elementary School, and Youtz Intermediate School.
Ownership History
Date
Name
Owned For
Owner Type
Purchase Details
Closed on
Feb 9, 2010
Sold by
Longenecker Donald Lee and Longenecker Candy L
Bought by
Butts Joseph E and Butts Cassidy A
Current Estimated Value
Purchase Details
Closed on
Oct 21, 2004
Sold by
Jones William E and Jones Lois
Bought by
Longenecker Donald Lee and Longenecker Candy L
Purchase Details
Closed on
May 13, 2002
Sold by
Jones William E
Bought by
Jones Lu Ann
Home Financials for this Owner
Home Financials are based on the most recent Mortgage that was taken out on this home.
Original Mortgage
$54,050
Interest Rate
10.48%
Mortgage Type
Seller Take Back
Purchase Details
Closed on
Oct 30, 2000
Sold by
Patricia Caver
Bought by
Jones William E
Home Financials for this Owner
Home Financials are based on the most recent Mortgage that was taken out on this home.
Original Mortgage
$39,952
Interest Rate
7.91%
Mortgage Type
Purchase Money Mortgage
Create a Home Valuation Report for This Property
The Home Valuation Report is an in-depth analysis detailing your home's value as well as a comparison with similar homes in the area
Home Values in the Area
Average Home Value in this Area
Purchase History
| Date | Buyer | Sale Price | Title Company |
|---|---|---|---|
| Butts Joseph E | $11,000 | Attorney | |
| Longenecker Donald Lee | $17,000 | Quest Title Agency Inc | |
| Jones Lu Ann | $55,000 | -- | |
| Jones William E | $46,500 | Northeast Title Agency Inc |
Source: Public Records
Mortgage History
| Date | Status | Borrower | Loan Amount |
|---|---|---|---|
| Previous Owner | Jones Lu Ann | $54,050 | |
| Previous Owner | Jones William E | $39,952 |
Source: Public Records
Tax History Compared to Growth
Tax History
| Year | Tax Paid | Tax Assessment Tax Assessment Total Assessment is a certain percentage of the fair market value that is determined by local assessors to be the total taxable value of land and additions on the property. | Land | Improvement |
|---|---|---|---|---|
| 2025 | $6,062 | $22,300 | $1,680 | $20,620 |
| 2024 | $4,710 | $22,300 | $1,680 | $20,620 |
| 2023 | $4,588 | $10,120 | $1,370 | $8,750 |
| 2022 | $592 | $10,120 | $1,370 | $8,750 |
| 2021 | $598 | $10,120 | $1,370 | $8,750 |
| 2020 | $532 | $8,050 | $1,120 | $6,930 |
| 2019 | $465 | $8,050 | $1,120 | $6,930 |
| 2018 | $467 | $8,050 | $1,120 | $6,930 |
| 2017 | $2,312 | $7,810 | $1,580 | $6,230 |
| 2016 | $2,824 | $7,810 | $1,580 | $6,230 |
| 2015 | $527 | $7,810 | $1,580 | $6,230 |
| 2014 | $927 | $8,060 | $1,610 | $6,450 |
| 2013 | $267 | $8,060 | $1,610 | $6,450 |
Source: Public Records
Map
Nearby Homes
- 1322 Struble Ave NE
- 0 Young Ave NE Unit 5145944
- 1325 Maddrell Ct NE
- 1412 Miami Ct NE
- 1447 Shriver Ave NE
- 1422 Plain Ave NE
- 1525 14th St NE
- 1605 12th St NE
- 1332 Spring Ave NE
- 1515 Parkhill Place NE
- 1521 Gibbs Ave NE
- 1454 Spring Ave NE
- 1611 Rowland Ave NE
- 1540 Miami Ct NE
- 1631 Shriver Ave NE
- 1517 16th St NE
- 1643 Olive Place NE
- 1219 17th St NE
- 211 15th St NE
- 802 17th St NE
- 1221 Rowland Ave NE
- 1211 Rowland Ave NE
- 1225 Rowland Ave NE
- 1215 Laiblin Place NE
- 1209 Rowland Ave NE
- 1235 12th St NE
- 1227 Rowland Ave NE
- 1227 12th St NE
- 1218 Rowland Ave NE
- 1213 Laiblin Place NE
- 1210 Rowland Ave NE
- 1237 12th St NE
- 1303 Rowland Ave NE
- 1222 Rowland Ave NE
- 1211 Laiblin Place NE
- 1301 12th St NE
- 1308 Laiblin Place NE
- 1226 Struble Ave NE
- 1303 12th St NE
- 1307 Rowland Ave NE