
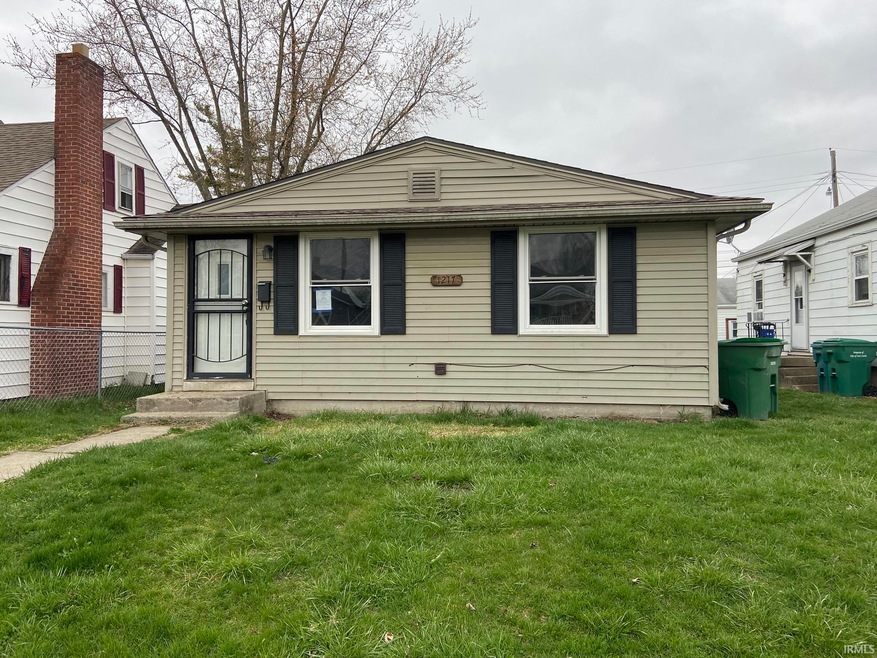

1217 S 23rd St New Castle, IN 47362
New Castle Neighborhood
3
Beds
1
Bath
912
Sq Ft
4,661
Sq Ft Lot
Highlights
- 1.5 Car Detached Garage
- 1-Story Property
- Central Air
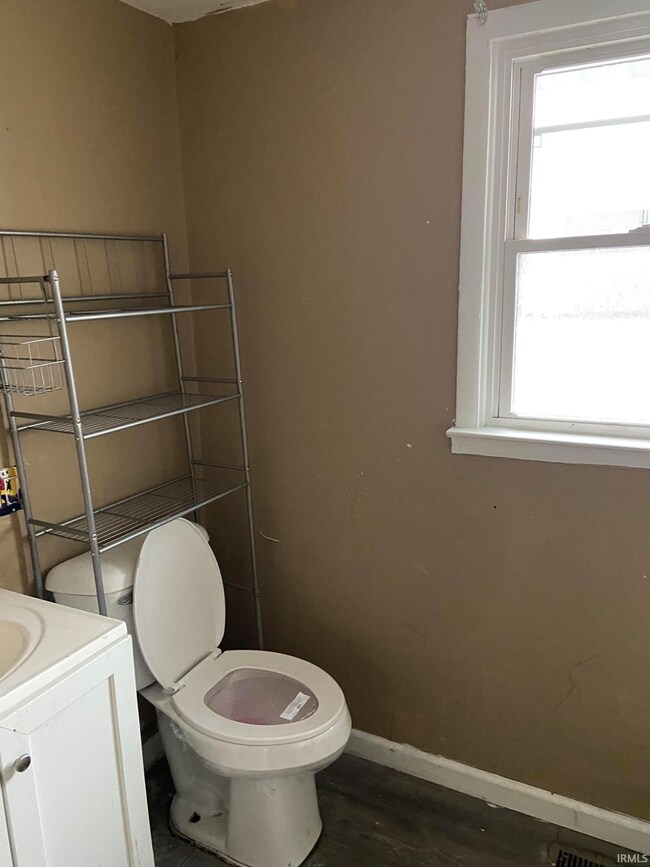
About This Home
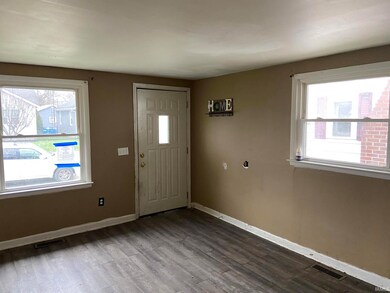
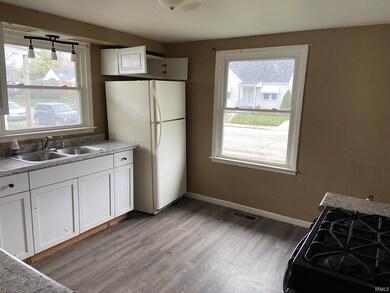
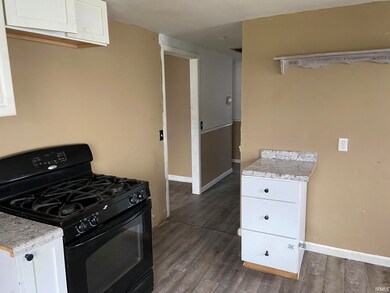
As of February 2025Take a look at this 3 bedroom, 1 bath ranch style home with 1 car garage. Sold as-is.
Last Buyer's Agent
ECBOR NonMember
NonMember ELK
Home Details
Home Type
- Single Family
Est. Annual Taxes
- $554
Year Built
- Built in 1955
Lot Details
- 4,661 Sq Ft Lot
- Lot Dimensions are 40x117
- Sloped Lot
Parking
- 1.5 Car Detached Garage
Home Design
- Vinyl Construction Material
Interior Spaces
- 912 Sq Ft Home
- 1-Story Property
- Crawl Space
Bedrooms and Bathrooms
- 3 Bedrooms
- 1 Full Bathroom
Schools
- Eastwood Elementary School
- New Castle Middle School
- New Castle High School
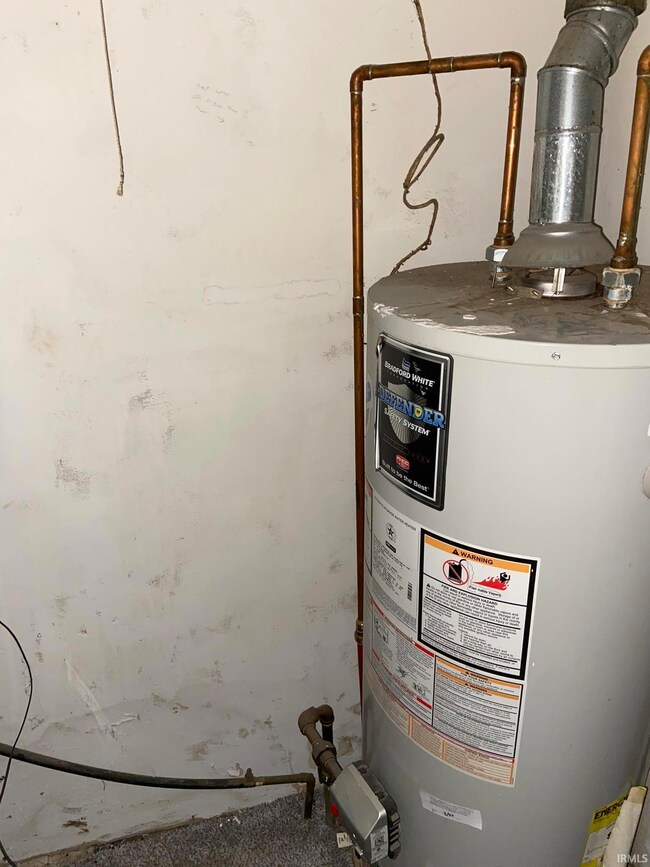
Utilities
- Central Air
- Heating System Uses Gas
Listing and Financial Details
- Assessor Parcel Number 33-12-14-320-371.000-016
Ownership History
Date
Name
Owned For
Owner Type
Purchase Details
Listed on
Jun 24, 2024
Closed on
Feb 6, 2025
Sold by
Heimer Real Estate Llc
Bought by
Rwa Properties Llc
Seller's Agent
Michael Johnson
Vylla Home
Buyer's Agent
ECBOR NonMember
NonMember ELK
List Price
$84,900
Sold Price
$45,000
Premium/Discount to List
-$39,900
-47%
Views
176
Current Estimated Value
Home Financials for this Owner
Home Financials are based on the most recent Mortgage that was taken out on this home.
Estimated Appreciation
$24,865
Avg. Annual Appreciation
185.02%
Purchase Details
Closed on
Dec 7, 2023
Sold by
Sheriff John Sproles
Bought by
Carrington Mortgage Services Llc
Purchase Details
Listed on
Mar 15, 2021
Closed on
Jun 2, 2021
Sold by
Chowning Andrew and Brannon Cheyanne
Bought by
Jones Alicia D
Seller's Agent
Jon Kindred
F.C. Tucker/Crossroads Real Estate
Buyer's Agent
Jon Kindred
F.C. Tucker/Crossroads Real Estate
List Price
$70,000
Sold Price
$73,500
Premium/Discount to List
$3,500
5%
Home Financials for this Owner
Home Financials are based on the most recent Mortgage that was taken out on this home.
Avg. Annual Appreciation
-1.23%
Original Mortgage
$75,757
Interest Rate
2.9%
Mortgage Type
New Conventional
Purchase Details
Listed on
Jul 16, 2018
Closed on
Feb 25, 2019
Sold by
Nhpb Properties Llc
Bought by
Chowning Andrew and Brannon Cheyanne
Seller's Agent
Mike McKown
F.C. Tucker/Crossroads Real Estate
Buyer's Agent
Mike McKown
F.C. Tucker/Crossroads Real Estate
List Price
$69,900
Sold Price
$56,000
Premium/Discount to List
-$13,900
-19.89%
Home Financials for this Owner
Home Financials are based on the most recent Mortgage that was taken out on this home.
Avg. Annual Appreciation
12.79%
Original Mortgage
$57,575
Interest Rate
4.4%
Mortgage Type
New Conventional
Purchase Details
Listed on
May 5, 2017
Closed on
Jun 29, 2017
Sold by
Heck John L and Heck Claudette E
Bought by
Nhpb Properties Llc
Seller's Agent
Matt Huffman
F.C. Tucker/Crossroads Real Estate
Buyer's Agent
Eric Linder
Berkshire Hathaway HomeServices Indiana Realty
List Price
$52,500
Sold Price
$48,000
Premium/Discount to List
-$4,500
-8.57%
Home Financials for this Owner
Home Financials are based on the most recent Mortgage that was taken out on this home.
Avg. Annual Appreciation
9.67%
Similar Homes in New Castle, IN
Create a Home Valuation Report for This Property
The Home Valuation Report is an in-depth analysis detailing your home's value as well as a comparison with similar homes in the area
Home Values in the Area
Average Home Value in this Area
Purchase History
| Date | Type | Sale Price | Title Company |
|---|---|---|---|
| Deed | $133,354 | Investors Title Service Inc | |
| Deed | $45,000 | Investors Title Service Inc | |
| Deed | $65,320 | Logs Legal Group Llp | |
| Warranty Deed | $73,500 | None Available | |
| Warranty Deed | -- | None Available | |
| Warranty Deed | $48,000 | Empire Title Services |
Source: Public Records
Mortgage History
| Date | Status | Loan Amount | Loan Type |
|---|---|---|---|
| Previous Owner | $75,757 | New Conventional | |
| Previous Owner | $57,575 | New Conventional |
Source: Public Records
Property History
| Date | Event | Price | Change | Sq Ft Price |
|---|---|---|---|---|
| 02/06/2025 02/06/25 | Sold | $45,000 | -24.9% | $49 / Sq Ft |
| 12/27/2024 12/27/24 | Pending | -- | -- | -- |
| 11/01/2024 11/01/24 | Price Changed | $59,900 | -25.0% | $66 / Sq Ft |
| 09/18/2024 09/18/24 | Price Changed | $79,900 | -5.9% | $88 / Sq Ft |
| 06/24/2024 06/24/24 | For Sale | $84,900 | +15.5% | $93 / Sq Ft |
| 06/02/2021 06/02/21 | Sold | $73,500 | +5.0% | $81 / Sq Ft |
| 03/15/2021 03/15/21 | Pending | -- | -- | -- |
| 03/15/2021 03/15/21 | For Sale | $70,000 | +25.0% | $77 / Sq Ft |
| 02/28/2019 02/28/19 | Sold | $56,000 | -6.5% | $61 / Sq Ft |
| 01/21/2019 01/21/19 | Pending | -- | -- | -- |
| 10/29/2018 10/29/18 | Price Changed | $59,900 | -7.7% | $66 / Sq Ft |
| 09/05/2018 09/05/18 | Price Changed | $64,900 | -7.2% | $71 / Sq Ft |
| 07/16/2018 07/16/18 | For Sale | $69,900 | +45.6% | $77 / Sq Ft |
| 06/29/2017 06/29/17 | Sold | $48,000 | 0.0% | $53 / Sq Ft |
| 06/29/2017 06/29/17 | Sold | $48,000 | -10.3% | $53 / Sq Ft |
| 05/10/2017 05/10/17 | Pending | -- | -- | -- |
| 05/10/2017 05/10/17 | Pending | -- | -- | -- |
| 05/05/2017 05/05/17 | For Sale | $53,500 | +1.9% | $59 / Sq Ft |
| 05/05/2017 05/05/17 | For Sale | $52,500 | +9.4% | $58 / Sq Ft |
| 05/01/2017 05/01/17 | Off Market | $48,000 | -- | -- |
| 04/18/2017 04/18/17 | For Sale | $53,500 | 0.0% | $59 / Sq Ft |
| 04/12/2017 04/12/17 | Pending | -- | -- | -- |
| 04/04/2017 04/04/17 | Price Changed | $53,500 | -2.6% | $59 / Sq Ft |
| 02/01/2017 02/01/17 | For Sale | $54,900 | -- | $60 / Sq Ft |
Source: Indiana Regional MLS
Tax History Compared to Growth
Tax History
| Year | Tax Paid | Tax Assessment Tax Assessment Total Assessment is a certain percentage of the fair market value that is determined by local assessors to be the total taxable value of land and additions on the property. | Land | Improvement |
|---|---|---|---|---|
| 2024 | $368 | $18,400 | $9,000 | $9,400 |
| 2023 | $554 | $62,000 | $9,000 | $53,000 |
| 2022 | $531 | $53,100 | $6,000 | $47,100 |
| 2021 | $317 | $40,300 | $6,000 | $34,300 |
| 2020 | $340 | $40,500 | $6,000 | $34,500 |
| 2019 | $317 | $39,100 | $6,000 | $33,100 |
| 2018 | $662 | $31,900 | $5,400 | $26,500 |
| 2017 | $690 | $31,600 | $5,400 | $26,200 |
| 2016 | $804 | $37,000 | $6,400 | $30,600 |
| 2014 | $831 | $39,600 | $7,900 | $31,700 |
| 2013 | $831 | $38,100 | $7,900 | $30,200 |
Source: Public Records
Agents Affiliated with this Home
-
Michael Johnson
Seller's Agent in 2025
Michael Johnson
Vylla Home
(260) 255-6465
6 in this area
145 Total Sales
-
E
Buyer's Agent in 2025
ECBOR NonMember
NonMember ELK
-
Jon Kindred
Seller's Agent in 2021
Jon Kindred
F.C. Tucker/Crossroads Real Estate
(765) 465-9409
161 in this area
366 Total Sales
-
M
Seller's Agent in 2019
Mike McKown
F.C. Tucker/Crossroads Real Estate
-
Matt Huffman
Seller's Agent in 2017
Matt Huffman
F.C. Tucker/Crossroads Real Estate
(765) 524-4985
36 in this area
60 Total Sales
-
M
Seller's Agent in 2017
Matthew Huffman
F.C. Tucker/Crossroads Real Estate
Map
Source: Indiana Regional MLS
MLS Number: 202423225
APN: 33-12-14-320-371.000-016
Disclaimer: Certain information contained herein is derived from information provided by parties other than Homes.com. All information provided is deemed reliable, but is not guaranteed to be accurate and should be independently verified.
![]() IDX information is provided exclusively for personal, non-commercial use, and may not be used for any purpose other than to identify prospective properties consumers may be interested in purchasing. Information is deemed reliable but not guaranteed.
IDX information is provided exclusively for personal, non-commercial use, and may not be used for any purpose other than to identify prospective properties consumers may be interested in purchasing. Information is deemed reliable but not guaranteed.
Nearby Homes