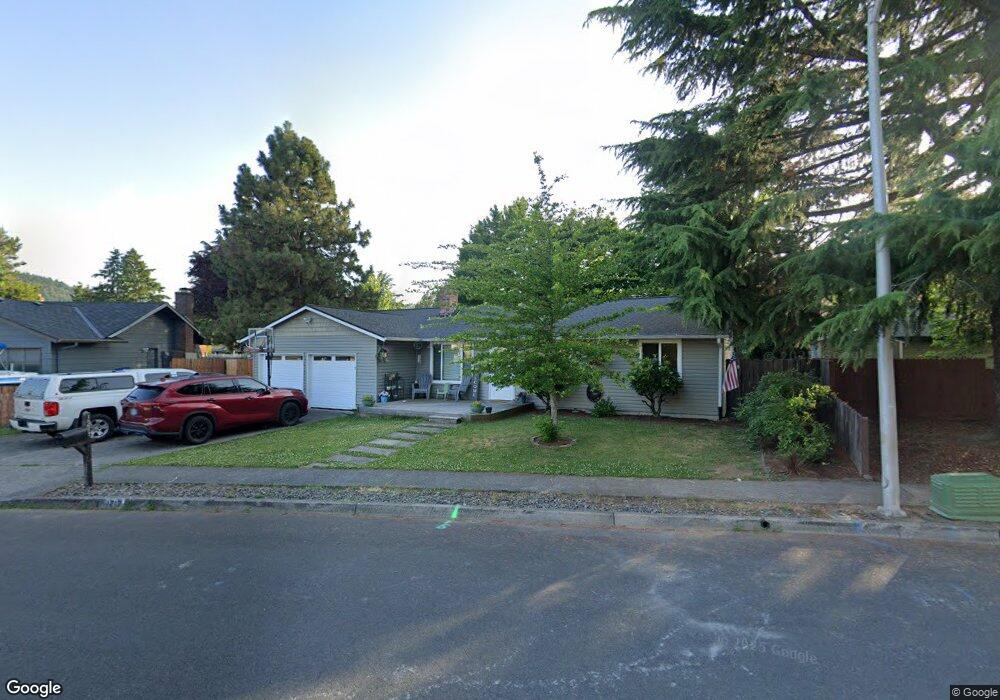
1217 SE Maple Place Gresham, OR 97080
Historic Southeast NeighborhoodEstimated Value: $406,000 - $473,000
3
Beds
2
Baths
1,260
Sq Ft
$351/Sq Ft
Est. Value
About This Home
This home is located at 1217 SE Maple Place, Gresham, OR 97080 and is currently estimated at $442,874, approximately $351 per square foot. 1217 SE Maple Place is a home located in Multnomah County with nearby schools including East Gresham Elementary School, Dexter McCarty Middle School, and Gresham High School.
Ownership History
Date
Name
Owned For
Owner Type
Purchase Details
Closed on
Sep 30, 2022
Sold by
Wolf Nathaniel F
Bought by
Wolf Nathaniel F and Wolf Charlie M
Current Estimated Value
Home Financials for this Owner
Home Financials are based on the most recent Mortgage that was taken out on this home.
Original Mortgage
$334,299
Outstanding Balance
$320,136
Interest Rate
5.55%
Mortgage Type
New Conventional
Estimated Equity
$122,738
Purchase Details
Closed on
Jul 3, 2017
Sold by
Hartley Paul
Bought by
Wolf Nathaniel F and Neilan Charlie M
Home Financials for this Owner
Home Financials are based on the most recent Mortgage that was taken out on this home.
Original Mortgage
$274,928
Interest Rate
3.95%
Mortgage Type
FHA
Purchase Details
Closed on
Oct 24, 2002
Sold by
Neilan Todd
Bought by
Hartley Paul and Hartley Ericka
Home Financials for this Owner
Home Financials are based on the most recent Mortgage that was taken out on this home.
Original Mortgage
$158,049
Interest Rate
5.99%
Mortgage Type
VA
Create a Home Valuation Report for This Property
The Home Valuation Report is an in-depth analysis detailing your home's value as well as a comparison with similar homes in the area
Home Values in the Area
Average Home Value in this Area
Purchase History
| Date | Buyer | Sale Price | Title Company |
|---|---|---|---|
| Wolf Nathaniel F | -- | -- | |
| Wolf Nathaniel F | $280,000 | First American | |
| Hartley Paul | $154,950 | Chicago Title |
Source: Public Records
Mortgage History
| Date | Status | Borrower | Loan Amount |
|---|---|---|---|
| Open | Wolf Nathaniel F | $334,299 | |
| Previous Owner | Wolf Nathaniel F | $274,928 | |
| Previous Owner | Hartley Paul | $158,049 |
Source: Public Records
Tax History
| Year | Tax Paid | Tax Assessment Tax Assessment Total Assessment is a certain percentage of the fair market value that is determined by local assessors to be the total taxable value of land and additions on the property. | Land | Improvement |
|---|---|---|---|---|
| 2025 | $4,892 | $240,400 | -- | -- |
| 2024 | $4,683 | $233,400 | -- | -- |
| 2023 | $4,267 | $226,610 | $0 | $0 |
| 2022 | $4,147 | $220,010 | $0 | $0 |
| 2021 | $4,043 | $213,610 | $0 | $0 |
| 2020 | $3,804 | $207,390 | $0 | $0 |
| 2019 | $3,704 | $201,350 | $0 | $0 |
| 2018 | $3,532 | $195,490 | $0 | $0 |
| 2017 | $3,389 | $189,800 | $0 | $0 |
| 2016 | $2,988 | $184,280 | $0 | $0 |
Source: Public Records
Map
Nearby Homes
- 955 SE Hogan Rd
- 1691 SE Cedar Creek Place
- 1949 SE Palmquist Rd Unit 51
- 1949 SE Palmquist Rd Unit 91
- 1949 SE Palmquist Rd Unit 7
- 1949 SE Palmquist Rd Unit 121
- 2137 SE 15th Aly
- 1918 SE Regner Rd
- 511 SE 15th St
- 2170 SE 16th St
- 2024 SE Spruce Ave
- 2293 SE 15th Aly
- 2240 SE 16th St
- 2358 SE Palmquist Rd
- 2125 SE 18th Aly
- 1715 SE 5th St Unit 1725
- 732 SE Rene Ave
- 450 SE Hogan Rd
- 2392 SE 16th Aly
- 4740 SE 2nd St
- 1255 SE Maple Place
- 1224 SE Liberty Ave
- 1256 SE Liberty Ave
- 1395 SE 12th St
- 1162 SE Liberty Ave
- 1159 SE Maple Place
- 1190 SE Maple Place
- 1345 SE Liberty Ave
- 1150 SE Maple Place
- 1134 SE Liberty Ave
- 1129 SE Maple Place
- 1430 SE 12th St
- 1450 SE 12th St
- 1400 SE 12th St
- 1080 SE Liberty Ave
- 1195 SE Liberty Ave
- 1475 SE 12th St
- 1191 SE Liberty Ave
- 1460 SE 12th St
- 1255 SE Liberty Ave
Your Personal Tour Guide
Ask me questions while you tour the home.