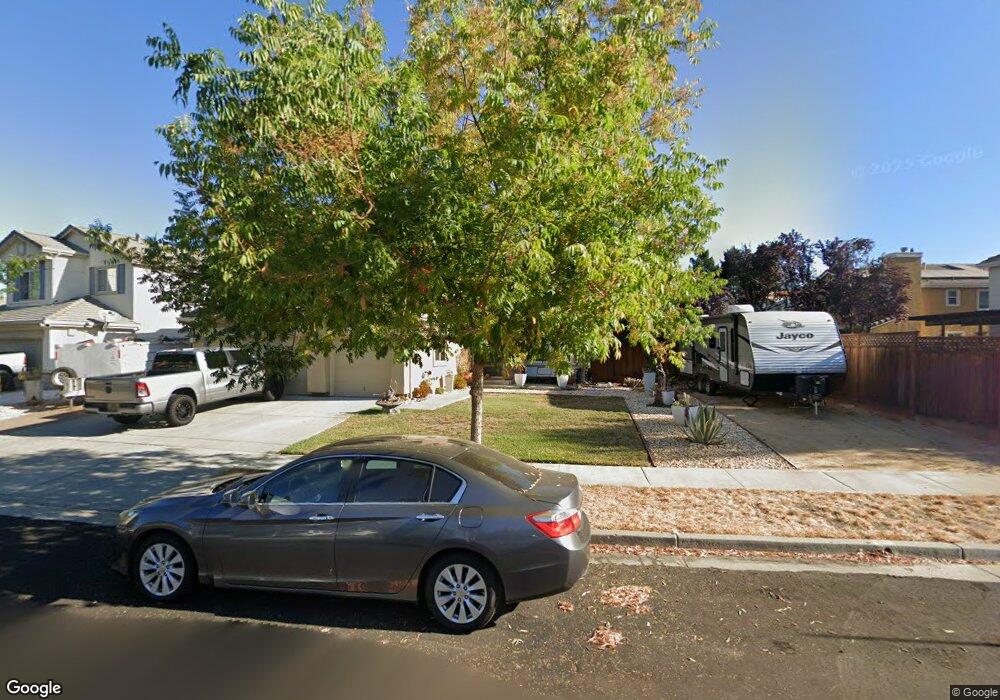
1217 Wagon Way Gilroy, CA 95020
Las Animas NeighborhoodEstimated Value: $1,278,210 - $1,335,000
6
Beds
3
Baths
2,930
Sq Ft
$448/Sq Ft
Est. Value
About This Home
This home is located at 1217 Wagon Way, Gilroy, CA 95020 and is currently estimated at $1,313,303, approximately $448 per square foot. 1217 Wagon Way is a home located in Santa Clara County with nearby schools including Luigi Aprea Elementary School, Brownell Middle School, and Solorsano Middle School.
Ownership History
Date
Name
Owned For
Owner Type
Purchase Details
Closed on
Jun 18, 2013
Sold by
Cordova Pedro and Cordova Bianca
Bought by
Cordova Pedro and Cordova Bianca
Current Estimated Value
Home Financials for this Owner
Home Financials are based on the most recent Mortgage that was taken out on this home.
Original Mortgage
$492,000
Outstanding Balance
$349,824
Interest Rate
3.48%
Mortgage Type
New Conventional
Estimated Equity
$963,479
Purchase Details
Closed on
Aug 19, 2009
Sold by
Bul Lalayao Francis and Bul Lalayao Joyceline
Bought by
Cordova Pedro and Cordova Bianca
Home Financials for this Owner
Home Financials are based on the most recent Mortgage that was taken out on this home.
Original Mortgage
$500,762
Interest Rate
5.19%
Mortgage Type
FHA
Purchase Details
Closed on
Aug 13, 1997
Sold by
Valley Title Company
Bought by
Bul Lalayao Francis and Bul Lalayao Joyceline
Home Financials for this Owner
Home Financials are based on the most recent Mortgage that was taken out on this home.
Original Mortgage
$275,100
Interest Rate
7.61%
Create a Home Valuation Report for This Property
The Home Valuation Report is an in-depth analysis detailing your home's value as well as a comparison with similar homes in the area
Home Values in the Area
Average Home Value in this Area
Purchase History
| Date | Buyer | Sale Price | Title Company |
|---|---|---|---|
| Cordova Pedro | -- | North American Title Company | |
| Cordova Pedro | $510,000 | Fidelity National Title Co | |
| Bul Lalayao Francis | $344,000 | Golden California Title Co |
Source: Public Records
Mortgage History
| Date | Status | Borrower | Loan Amount |
|---|---|---|---|
| Open | Cordova Pedro | $492,000 | |
| Closed | Cordova Pedro | $500,762 | |
| Previous Owner | Bul Lalayao Francis | $275,100 |
Source: Public Records
Tax History Compared to Growth
Tax History
| Year | Tax Paid | Tax Assessment Tax Assessment Total Assessment is a certain percentage of the fair market value that is determined by local assessors to be the total taxable value of land and additions on the property. | Land | Improvement |
|---|---|---|---|---|
| 2025 | $8,035 | $658,303 | $263,319 | $394,984 |
| 2024 | $8,035 | $645,396 | $258,156 | $387,240 |
| 2023 | $7,988 | $632,743 | $253,095 | $379,648 |
| 2022 | $7,857 | $620,337 | $248,133 | $372,204 |
| 2021 | $7,823 | $608,174 | $243,268 | $364,906 |
| 2020 | $7,737 | $601,939 | $240,774 | $361,165 |
| 2019 | $7,666 | $590,137 | $236,053 | $354,084 |
| 2018 | $7,158 | $578,567 | $231,425 | $347,142 |
| 2017 | $7,309 | $567,224 | $226,888 | $340,336 |
| 2016 | $7,163 | $556,103 | $222,440 | $333,663 |
| 2015 | $6,758 | $547,751 | $219,099 | $328,652 |
| 2014 | $6,716 | $537,023 | $214,808 | $322,215 |
Source: Public Records
Map
Nearby Homes
- 9632 Cherrywood Ct
- 1080 Sunrise Dr
- 1469 Eagles Nest Ln
- 1486 Swallow Ln
- 1469 Goshawk Ct
- 821 Koshare St
- 820 Woodcreek Way
- 1482 Goshawk Ct
- 1206 Sycamore Ct
- 9232 Kestrel Ct
- 9850 Bobcat Ct
- 8940 Acorn Way
- 1620 Welburn Ave
- 9938 Bobcat Ct
- 1515 Dovetail Way
- 670 Wickham Ct
- 9110 Tea Tree Way
- 1297 Chesbro Way
- 1810 Carob Ct
- 9045 Tea Tree Way
- 1237 Wagon Way
- 9370 Durango Ln
- 9359 Lone Deer Way
- 9349 Lone Deer Way
- 9369 Lone Deer Way
- 1222 Wagon Way
- 9380 Durango Ln
- 1212 Wagon Way
- 1232 Wagon Way
- 1202 Wagon Way
- 1242 Wagon Way
- 9329 Lone Deer Way
- 1162 Apache Ct
- 9351 Durango Ln
- 9386 Durango Ln
- 9361 Durango Ln
- 1252 Wagon Way
- 9371 Durango Ln
- 9319 Lone Deer Way
- 1172 Apache Ct