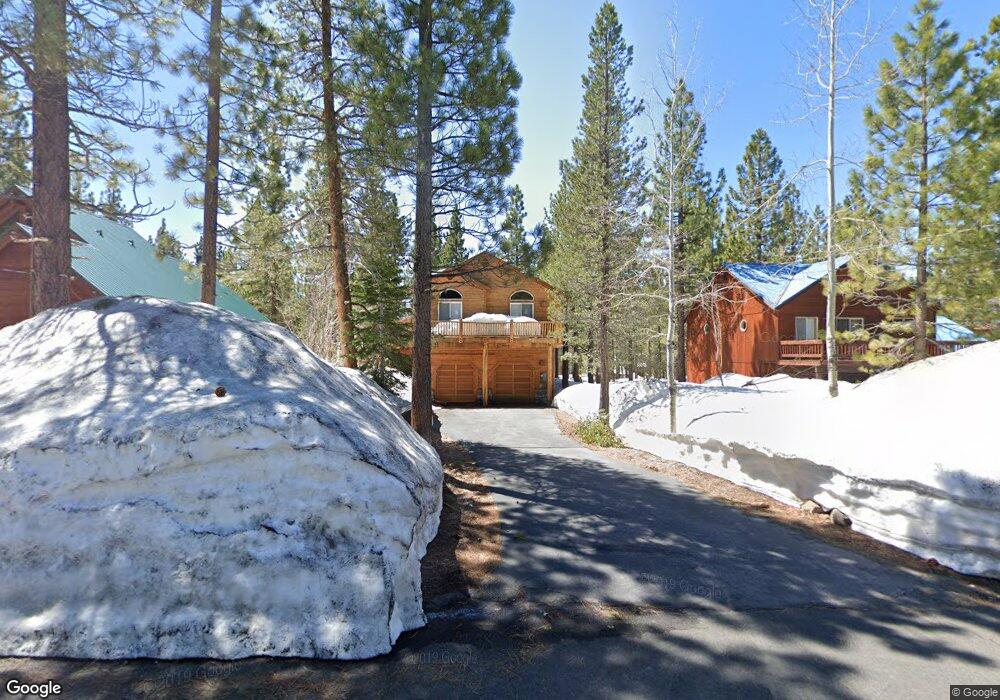
12177 Muhlebach Way Truckee, CA 96161
Tahoe Donner NeighborhoodEstimated Value: $1,076,488 - $1,294,000
--
Bed
--
Bath
2,439
Sq Ft
$486/Sq Ft
Est. Value
About This Home
This home is located at 12177 Muhlebach Way, Truckee, CA 96161 and is currently estimated at $1,185,372, approximately $486 per square foot. 12177 Muhlebach Way is a home located in Nevada County with nearby schools including Truckee Elementary School, Alder Creek Middle School, and Tahoe Truckee High School.
Ownership History
Date
Name
Owned For
Owner Type
Purchase Details
Closed on
Jun 10, 2008
Sold by
Zehnder Riele Gary Scott and Zehnder Riele Julie
Bought by
Riele Gary S and Riele Julie Z
Current Estimated Value
Purchase Details
Closed on
Apr 29, 1998
Sold by
Talbot Gary and Labia Yolanda
Bought by
Zehnder Riele Gary Scott and Zehnder Riele Julie
Home Financials for this Owner
Home Financials are based on the most recent Mortgage that was taken out on this home.
Original Mortgage
$227,150
Outstanding Balance
$44,229
Interest Rate
7.06%
Estimated Equity
$1,141,143
Purchase Details
Closed on
Oct 16, 1997
Sold by
Drew David D
Bought by
Talbot Gary and Labia Yolanda
Home Financials for this Owner
Home Financials are based on the most recent Mortgage that was taken out on this home.
Original Mortgage
$211,500
Interest Rate
7.49%
Purchase Details
Closed on
Nov 21, 1996
Sold by
Dalton Drew Michelle K and Dalton David
Bought by
Drew David Dalton
Create a Home Valuation Report for This Property
The Home Valuation Report is an in-depth analysis detailing your home's value as well as a comparison with similar homes in the area
Home Values in the Area
Average Home Value in this Area
Purchase History
| Date | Buyer | Sale Price | Title Company |
|---|---|---|---|
| Riele Gary S | -- | None Available | |
| Zehnder Riele Gary Scott | $295,000 | Placer Title Company | |
| Talbot Gary | $46,000 | Placer Title Company | |
| Drew David Dalton | -- | -- |
Source: Public Records
Mortgage History
| Date | Status | Borrower | Loan Amount |
|---|---|---|---|
| Open | Zehnder Riele Gary Scott | $227,150 | |
| Previous Owner | Talbot Gary | $211,500 |
Source: Public Records
Tax History Compared to Growth
Tax History
| Year | Tax Paid | Tax Assessment Tax Assessment Total Assessment is a certain percentage of the fair market value that is determined by local assessors to be the total taxable value of land and additions on the property. | Land | Improvement |
|---|---|---|---|---|
| 2025 | $6,627 | $474,021 | $76,439 | $397,582 |
| 2024 | $6,532 | $464,728 | $74,941 | $389,787 |
| 2023 | $6,532 | $455,617 | $73,472 | $382,145 |
| 2022 | $6,322 | $446,684 | $72,032 | $374,652 |
| 2021 | $5,986 | $437,867 | $70,561 | $367,306 |
| 2020 | $5,940 | $433,378 | $69,838 | $363,540 |
| 2019 | $5,926 | $424,881 | $68,469 | $356,412 |
| 2018 | $5,403 | $416,551 | $67,127 | $349,424 |
| 2017 | $5,272 | $408,388 | $65,815 | $342,573 |
| 2016 | $5,219 | $399,612 | $63,756 | $335,856 |
| 2015 | $5,103 | $393,613 | $62,801 | $330,812 |
| 2014 | $5,103 | $385,905 | $61,573 | $324,332 |
Source: Public Records
Map
Nearby Homes
- 14191 Hansel Ave
- 12972 Muhlebach Way
- 12765 Northwoods Blvd
- 12799 Northwoods Blvd Unit 2
- 12471 Northwoods Blvd Unit 1
- 12804 Northwoods Blvd Unit 441
- 12611 Muhlebach Way
- 13075 Northwoods Blvd
- 13239 Northwoods Blvd Unit B
- 13701 Hansel Ave
- 13441 Cristallina Way
- 12705 Falcon Point Place
- 13673 Hansel Ave
- 13485 Cristallina Way
- 11781 Chamonix Rd
- 11964 Saint Bernard Dr
- 11511 Baden Rd
- 12574 Saint Moritz Ln
- 11554 Saint Bernard Dr
- 11665 Zermatt Dr
- 12191 Muhlebach Way
- 12163 Muhlebach Way
- 12205 Muhlebach Way
- 12149 Muhlebach Way
- 13286 Roundhill Dr
- 12221 Muhlebach Way
- 13272 Roundhill Dr
- 12178 Muhlebach Way
- 12192 Muhlebach Way
- 12135 Muhlebach Way
- 13300 Roundhill Dr Unit 10
- 13300 Roundhill Dr
- 12206 Muhlebach Way
- 13258 Roundhill Dr
- 12233 Muhlebach Way Unit 10
- 12233 Muhlebach Way
- 12150 Muhlebach Way
- 12136 Muhlebach Way
- 13328 Roundhill Dr
- 13244 Roundhill Dr