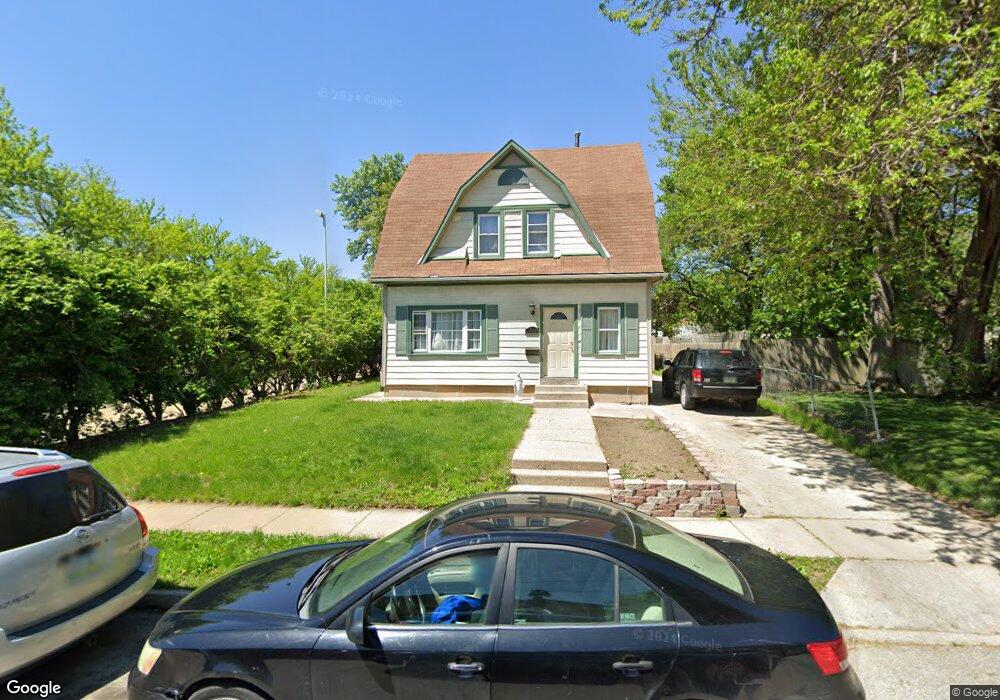
1218 11th St Des Moines, IA 50314
King Irving NeighborhoodEstimated Value: $132,000 - $207,000
3
Beds
1
Bath
1,393
Sq Ft
$111/Sq Ft
Est. Value
About This Home
This home is located at 1218 11th St, Des Moines, IA 50314 and is currently estimated at $154,476, approximately $110 per square foot. 1218 11th St is a home located in Polk County with nearby schools including Moulton Elementary School, Harding Middle School, and North High School.
Ownership History
Date
Name
Owned For
Owner Type
Purchase Details
Closed on
Feb 10, 2006
Sold by
Mares Rodrigo and Mares Gabriela
Bought by
Delgado Maria
Current Estimated Value
Purchase Details
Closed on
Oct 26, 2001
Sold by
Drake Cynthia
Bought by
Mares Rodrigo and Mares Gabriela
Home Financials for this Owner
Home Financials are based on the most recent Mortgage that was taken out on this home.
Original Mortgage
$45,000
Interest Rate
9%
Mortgage Type
Seller Take Back
Create a Home Valuation Report for This Property
The Home Valuation Report is an in-depth analysis detailing your home's value as well as a comparison with similar homes in the area
Home Values in the Area
Average Home Value in this Area
Purchase History
| Date | Buyer | Sale Price | Title Company |
|---|---|---|---|
| Delgado Maria | -- | None Available | |
| Mares Rodrigo | $49,500 | None Available | |
| Mares Rodrigo | $50,000 | -- |
Source: Public Records
Mortgage History
| Date | Status | Borrower | Loan Amount |
|---|---|---|---|
| Previous Owner | Mares Rodrigo | $45,000 |
Source: Public Records
Tax History Compared to Growth
Tax History
| Year | Tax Paid | Tax Assessment Tax Assessment Total Assessment is a certain percentage of the fair market value that is determined by local assessors to be the total taxable value of land and additions on the property. | Land | Improvement |
|---|---|---|---|---|
| 2025 | $1,930 | $114,200 | $13,700 | $100,500 |
| 2024 | $1,930 | $98,100 | $11,700 | $86,400 |
| 2023 | $1,700 | $98,100 | $11,700 | $86,400 |
| 2022 | $1,686 | $72,100 | $8,900 | $63,200 |
| 2021 | $1,614 | $72,100 | $8,900 | $63,200 |
| 2020 | $1,678 | $64,700 | $7,900 | $56,800 |
| 2019 | $1,588 | $64,700 | $7,900 | $56,800 |
| 2018 | $1,376 | $59,100 | $7,100 | $52,000 |
| 2017 | $1,396 | $59,100 | $7,100 | $52,000 |
| 2016 | $1,360 | $60,500 | $7,000 | $53,500 |
| 2015 | $1,360 | $60,500 | $7,000 | $53,500 |
| 2014 | $1,370 | $54,200 | $6,900 | $47,300 |
Source: Public Records
Map
Nearby Homes
- 1311 11th St
- 1167 11th St
- 1251 10th St
- 1311 10th St
- 1221 Forest Ave
- 1420 10th St
- 1423 12th St
- 1004 Laurel St Unit 18
- 1420 9th St
- 1315 7th St
- 1021 11th St Unit 9
- 1347 Forest Ave
- 1418 8th St
- 1003 Day St Unit 23
- 1001 Day St Unit 24
- 1054 14th St
- 1503 13th St
- 1503 Forest Ave
- 1330 Clark St
- 1414 Harrison Ave