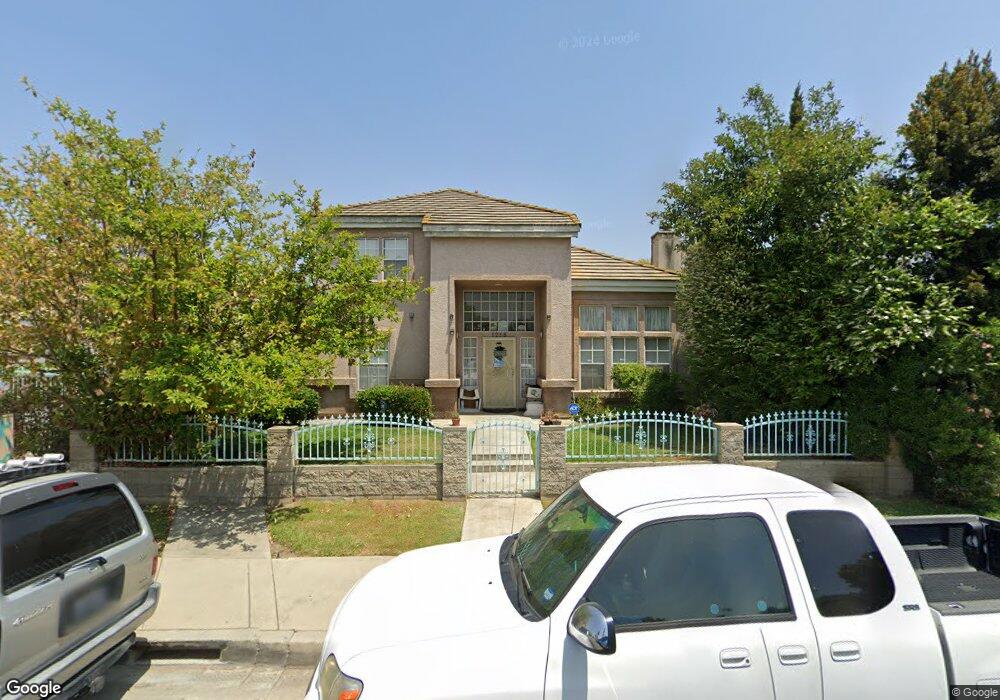
1218 Ballista Ave La Puente, CA 91744
Estimated Value: $674,000 - $710,000
3
Beds
3
Baths
1,728
Sq Ft
$402/Sq Ft
Est. Value
About This Home
This home is located at 1218 Ballista Ave, La Puente, CA 91744 and is currently estimated at $695,375, approximately $402 per square foot. 1218 Ballista Ave is a home located in Los Angeles County with nearby schools including Baldwin Academy, Sierra Vista Middle School, and William Workman High School.
Ownership History
Date
Name
Owned For
Owner Type
Purchase Details
Closed on
Mar 19, 2009
Sold by
Nguyen Liem T
Bought by
Vuong Hang T
Current Estimated Value
Purchase Details
Closed on
Sep 20, 1999
Sold by
Ku Chen Ming
Bought by
Nguyen Liem T
Home Financials for this Owner
Home Financials are based on the most recent Mortgage that was taken out on this home.
Original Mortgage
$119,200
Interest Rate
6.87%
Purchase Details
Closed on
Jul 20, 1999
Sold by
Ku Pao Chu
Bought by
Ku Chen Ming
Purchase Details
Closed on
Jun 15, 1999
Sold by
Huey Ying Kao and Xing Ping
Bought by
Ku Chen Ming
Purchase Details
Closed on
Jun 24, 1994
Sold by
Sorrento Court Partnership
Bought by
Kao Huey Ying
Home Financials for this Owner
Home Financials are based on the most recent Mortgage that was taken out on this home.
Original Mortgage
$129,000
Interest Rate
8.73%
Create a Home Valuation Report for This Property
The Home Valuation Report is an in-depth analysis detailing your home's value as well as a comparison with similar homes in the area
Home Values in the Area
Average Home Value in this Area
Purchase History
| Date | Buyer | Sale Price | Title Company |
|---|---|---|---|
| Vuong Hang T | -- | None Available | |
| Nguyen Liem T | $149,000 | Lawyers Title Company | |
| Ku Chen Ming | -- | Lawyers Title Company | |
| Ku Chen Ming | -- | Lawyers Title Company | |
| Kao Huey Ying | $172,000 | Commonwealth Land Title |
Source: Public Records
Mortgage History
| Date | Status | Borrower | Loan Amount |
|---|---|---|---|
| Previous Owner | Nguyen Liem T | $119,200 | |
| Previous Owner | Kao Huey Ying | $129,000 |
Source: Public Records
Tax History Compared to Growth
Tax History
| Year | Tax Paid | Tax Assessment Tax Assessment Total Assessment is a certain percentage of the fair market value that is determined by local assessors to be the total taxable value of land and additions on the property. | Land | Improvement |
|---|---|---|---|---|
| 2025 | $3,129 | $228,985 | $120,181 | $108,804 |
| 2024 | $3,129 | $224,496 | $117,825 | $106,671 |
| 2023 | $3,053 | $220,095 | $115,515 | $104,580 |
| 2022 | $2,968 | $215,780 | $113,250 | $102,530 |
| 2021 | $2,909 | $211,550 | $111,030 | $100,520 |
| 2019 | $2,830 | $205,278 | $107,738 | $97,540 |
| 2018 | $2,743 | $201,254 | $105,626 | $95,628 |
| 2016 | $2,554 | $193,440 | $101,525 | $91,915 |
| 2015 | $2,509 | $190,535 | $100,000 | $90,535 |
| 2014 | $2,475 | $186,804 | $98,042 | $88,762 |
Source: Public Records
Map
Nearby Homes
- 1329 N Stimson Ave
- 1174 Del Valle Ave
- 1358 N Stimson Ave
- 1084 Del Valle Ave
- 15704 Francisquito Ave
- 1260 Greenberry Dr
- 15625 Loukelton St
- 15925 Amar Rd
- 826 Del Valle Ave
- 15937 Amar Rd
- 15943 Amar Rd
- 15947 Amar Rd
- 1544 Evanwood Ave
- 829 Foxworth Ave
- 16138 Blackwood St
- 15416 Giordano St
- 16108 Maplegrove St
- 16138 Cadwell St
- 1406 S St Malo St
- 822 Greenberry Dr
- 1220 Ballista Ave
- 1226 Ballista Ave
- 1228 Ballista Ave
- 1228 1/2 Ballista Ave
- 1214 Ballista Ave Unit 3
- 1212 1/2 Ballista Ave
- 1212 Ballista Ave Unit 1
- 1210 Ballista Ave Unit A
- 1210 Ballista Ave Unit B
- 1216 Ballista Ave Unit 4
- 1222 Ballista Ave
- 1208 Ballista Ave
- 1232 Ballista Ave
- 1230 Ballista Ave
- 1224 Ballista Ave
- 1230 1/2 Ballista Ave
- 1202 Ballista Ave
- 1242 Ballista Ave
- 1223 Ballista Ave
- 1215 Ballista Ave