Estimated Value: $300,563 - $320,000
4
Beds
2
Baths
1,894
Sq Ft
$164/Sq Ft
Est. Value
About This Home
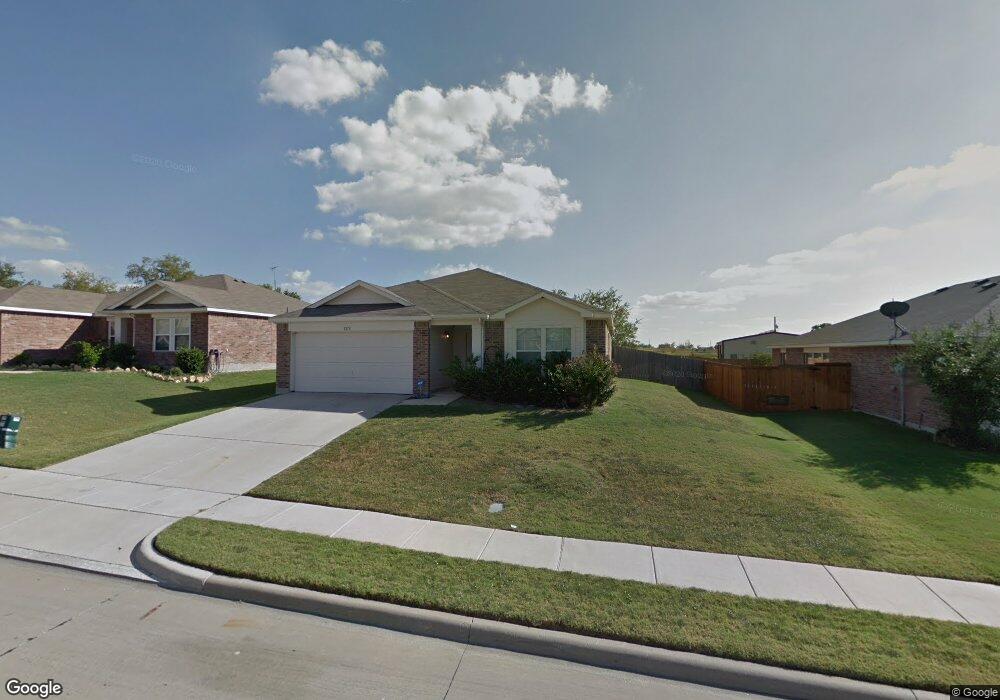
This home is located at 1218 Feather Crest Dr, Krum, TX 76249 and is currently estimated at $310,141, approximately $163 per square foot. 1218 Feather Crest Dr is a home located in Denton County with nearby schools including Krum Early Education Center, Blanche Dodd Intermediate School, and Krum Middle School.
Ownership History
Date
Name
Owned For
Owner Type
Purchase Details
Closed on
Mar 25, 2014
Sold by
Federal Home Loan Mortgage Corporation
Bought by
Ellis Lorna and Hilton Patricia
Current Estimated Value
Home Financials for this Owner
Home Financials are based on the most recent Mortgage that was taken out on this home.
Original Mortgage
$158,122
Interest Rate
4.46%
Mortgage Type
New Conventional
Purchase Details
Closed on
Dec 3, 2013
Sold by
Phillips Randy L and Phillips Kimberly D
Bought by
Federal Home Loan Mortgage Corporation
Purchase Details
Closed on
Aug 17, 2012
Sold by
Phillips Randy Lynn
Bought by
Phillips Kimberly Dee
Purchase Details
Closed on
Sep 5, 2007
Sold by
Rh Of Texas Lp
Bought by
Phillips Randy L and Phillips Kimberly D
Home Financials for this Owner
Home Financials are based on the most recent Mortgage that was taken out on this home.
Original Mortgage
$135,000
Interest Rate
6.63%
Mortgage Type
Purchase Money Mortgage
Create a Home Valuation Report for This Property
The Home Valuation Report is an in-depth analysis detailing your home's value as well as a comparison with similar homes in the area
Home Values in the Area
Average Home Value in this Area
Purchase History
| Date | Buyer | Sale Price | Title Company |
|---|---|---|---|
| Ellis Lorna | -- | Fnt | |
| Federal Home Loan Mortgage Corporation | $136,279 | None Available | |
| Phillips Kimberly Dee | -- | None Available | |
| Phillips Randy L | -- | Ryland Title |
Source: Public Records
Mortgage History
| Date | Status | Borrower | Loan Amount |
|---|---|---|---|
| Previous Owner | Ellis Lorna | $158,122 | |
| Previous Owner | Phillips Randy L | $135,000 |
Source: Public Records
Tax History Compared to Growth
Tax History
| Year | Tax Paid | Tax Assessment Tax Assessment Total Assessment is a certain percentage of the fair market value that is determined by local assessors to be the total taxable value of land and additions on the property. | Land | Improvement |
|---|---|---|---|---|
| 2025 | $2,130 | $296,996 | $68,202 | $228,794 |
| 2024 | $6,117 | $303,544 | $0 | $0 |
| 2023 | $1,969 | $275,949 | $68,202 | $266,015 |
| 2022 | $5,754 | $250,863 | $68,202 | $201,517 |
| 2021 | $5,057 | $228,057 | $49,257 | $178,800 |
| 2020 | $4,706 | $207,822 | $40,921 | $166,901 |
| 2019 | $5,023 | $208,178 | $40,921 | $168,565 |
| 2018 | $4,590 | $189,253 | $40,921 | $148,332 |
| 2017 | $4,340 | $178,159 | $40,921 | $137,238 |
| 2016 | $3,129 | $163,282 | $25,007 | $142,606 |
| 2015 | -- | $74,219 | $12,504 | $61,715 |
| 2014 | -- | $135,889 | $25,007 | $110,882 |
| 2013 | -- | $133,998 | $25,007 | $108,991 |
Source: Public Records
Map
Nearby Homes
- 205 Broken Arrow
- 1304 Dakota Trail
- 1404 Wenatchee Dr
- 905 Clearview St
- TBD E Mccart St
- 0 Farm To Market Road 1173
- 334 Saddlebrook Dr
- 1604 Withers Way
- 2309 Hillview Dr
- 1620 Kawati Way
- 1623 Withers Way
- 1627 Kawati Way
- 101 Thoroughbred Dr
- 3454 Eloise Ln
- 328 Broken Bow
- 8 S Sharon Dr
- 7272 Christina Ct
- TBD Masch Branch Rd
- 7257 Christina Ct
- 3537 Camden Creek Rd
- 1220 Feather Crest Dr
- 1216 Feather Crest Dr
- 1222 Feather Crest Dr
- 1214 Feather Crest Dr
- 1219 Feather Crest Dr
- 1217 Feather Crest Dr
- 1221 Feather Crest Dr
- 1224 Feather Crest Dr
- 1212 Feather Crest Dr
- 1215 Feather Crest Dr
- 1223 Feather Crest Dr
- 2663 Hillview Dr
- 1213 Feather Crest Dr
- 1226 Feather Crest Dr
- 1218 Eagles Nest Trail
- 1216 Eagles Nest Trail
- 1220 Eagles Nest Trail
- 1214 Eagles Nest Trail
- 1211 Feather Crest Dr
- 1222 Eagles Nest Trail