Estimated Value: $129,000 - $141,474
4
Beds
1
Bath
1,760
Sq Ft
$77/Sq Ft
Est. Value
About This Home
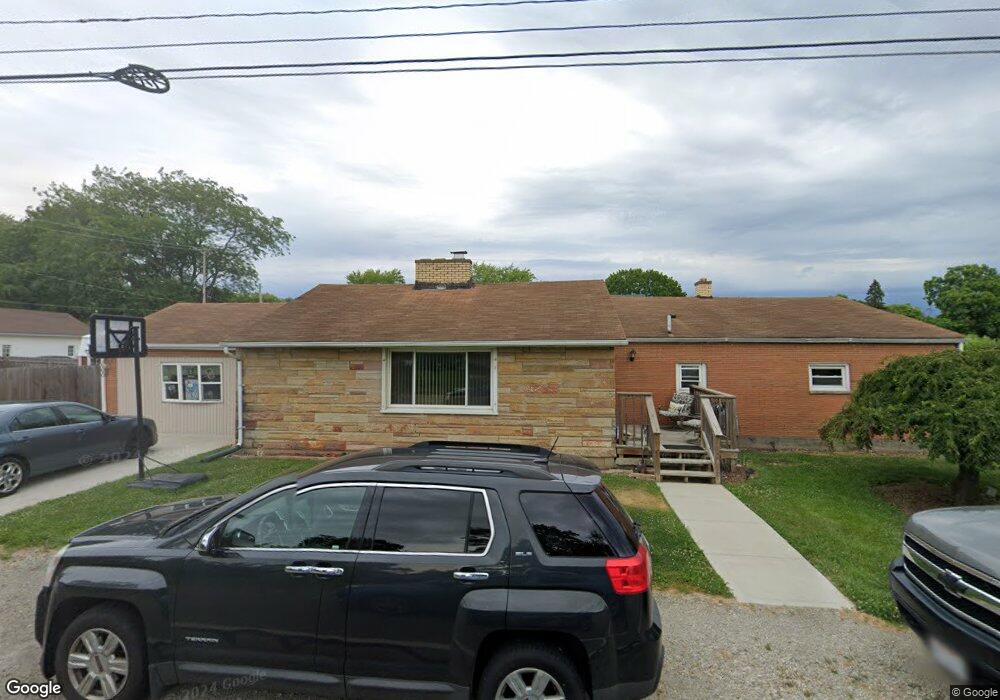
This home is located at 1218 Fisk St, Piqua, OH 45356 and is currently estimated at $135,825, approximately $77 per square foot. 1218 Fisk St is a home located in Miami County with nearby schools including Piqua Junior High School, Piqua High School, and Nicholas School.
Ownership History
Date
Name
Owned For
Owner Type
Purchase Details
Closed on
Dec 18, 2020
Sold by
Shoffner Victoria L and Cantwil Preservation Trust
Bought by
Shoffner Victoria L
Current Estimated Value
Purchase Details
Closed on
Nov 6, 2020
Sold by
Estate Of Deborah A Cantwil
Bought by
Shoffner Victoria L and The Cantwil Preservation Trust
Purchase Details
Closed on
Mar 26, 2018
Sold by
Trustee Of The Cantwil Preservation Trus and Shoffner Victoria E
Bought by
Shoffner Victoria E
Purchase Details
Closed on
Mar 28, 2005
Sold by
Smith Hazel
Bought by
Cantwil William A and Cantwil Deborah A
Home Financials for this Owner
Home Financials are based on the most recent Mortgage that was taken out on this home.
Original Mortgage
$50,000
Interest Rate
5.61%
Mortgage Type
New Conventional
Purchase Details
Closed on
Feb 26, 1990
Bought by
Smith Hazel
Create a Home Valuation Report for This Property
The Home Valuation Report is an in-depth analysis detailing your home's value as well as a comparison with similar homes in the area
Home Values in the Area
Average Home Value in this Area
Purchase History
| Date | Buyer | Sale Price | Title Company |
|---|---|---|---|
| Shoffner Victoria L | -- | None Available | |
| Shoffner Victoria L | -- | None Available | |
| Shoffner Victoria E | -- | None Listed On Document | |
| Cantwil William A | $57,000 | -- | |
| Smith Hazel | -- | -- |
Source: Public Records
Mortgage History
| Date | Status | Borrower | Loan Amount |
|---|---|---|---|
| Previous Owner | Cantwil William A | $50,000 |
Source: Public Records
Tax History Compared to Growth
Tax History
| Year | Tax Paid | Tax Assessment Tax Assessment Total Assessment is a certain percentage of the fair market value that is determined by local assessors to be the total taxable value of land and additions on the property. | Land | Improvement |
|---|---|---|---|---|
| 2024 | $1,008 | $26,390 | $6,440 | $19,950 |
| 2023 | $1,084 | $26,390 | $6,440 | $19,950 |
| 2022 | $1,103 | $26,390 | $6,440 | $19,950 |
| 2021 | $893 | $19,530 | $4,760 | $14,770 |
| 2020 | $898 | $19,530 | $4,760 | $14,770 |
| 2019 | $903 | $19,530 | $4,760 | $14,770 |
| 2018 | $905 | $18,660 | $4,760 | $13,900 |
| 2017 | $916 | $18,660 | $4,760 | $13,900 |
| 2016 | $906 | $18,660 | $4,760 | $13,900 |
| 2015 | $893 | $17,960 | $4,590 | $13,370 |
| 2014 | $893 | $17,960 | $4,590 | $13,370 |
| 2013 | $896 | $17,960 | $4,590 | $13,370 |
Source: Public Records
Map
Nearby Homes