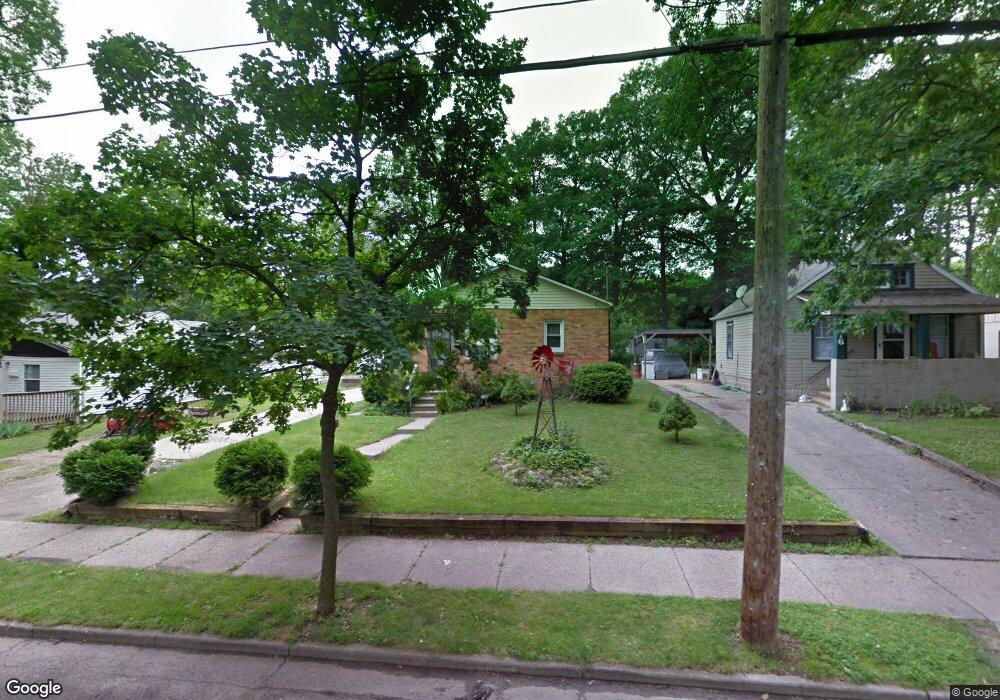
1218 Leslie St Lansing, MI 48912
Potter Walsh NeighborhoodEstimated Value: $70,000 - $104,000
--
Bed
--
Bath
768
Sq Ft
$107/Sq Ft
Est. Value
About This Home
This home is located at 1218 Leslie St, Lansing, MI 48912 and is currently estimated at $82,360, approximately $107 per square foot. 1218 Leslie St is a home located in Ingham County with nearby schools including Pattengill Academy, Lyons Elementary School, and Eastern High School.
Ownership History
Date
Name
Owned For
Owner Type
Purchase Details
Closed on
May 21, 2018
Sold by
Lisa D Adams
Bought by
Gilson Larry and Gilson Cecilia
Current Estimated Value
Home Financials for this Owner
Home Financials are based on the most recent Mortgage that was taken out on this home.
Original Mortgage
$96,800
Outstanding Balance
$83,747
Interest Rate
4.61%
Estimated Equity
-$1,387
Purchase Details
Closed on
Apr 19, 2002
Sold by
Walsh Marilyn J and The Marilyn J Walsh Trust
Bought by
Gilson Larry and Gilson Celcila
Home Financials for this Owner
Home Financials are based on the most recent Mortgage that was taken out on this home.
Original Mortgage
$38,000
Interest Rate
7.16%
Purchase Details
Closed on
Dec 13, 2000
Sold by
Walsh Gerald E and Walsh Marilyn J
Bought by
Walsh Marilyn J and Marilyn J Walsh Trust #1
Create a Home Valuation Report for This Property
The Home Valuation Report is an in-depth analysis detailing your home's value as well as a comparison with similar homes in the area
Home Values in the Area
Average Home Value in this Area
Purchase History
| Date | Buyer | Sale Price | Title Company |
|---|---|---|---|
| Gilson Larry | $121,000 | -- | |
| Gilson Larry | $20,000 | Chicago Title | |
| Walsh Marilyn J | -- | -- |
Source: Public Records
Mortgage History
| Date | Status | Borrower | Loan Amount |
|---|---|---|---|
| Open | Gilson Larry | $96,800 | |
| Closed | Gilson Larry | -- | |
| Previous Owner | Gilson Larry | $38,000 |
Source: Public Records
Tax History Compared to Growth
Tax History
| Year | Tax Paid | Tax Assessment Tax Assessment Total Assessment is a certain percentage of the fair market value that is determined by local assessors to be the total taxable value of land and additions on the property. | Land | Improvement |
|---|---|---|---|---|
| 2025 | $2,643 | $37,200 | $4,100 | $33,100 |
| 2024 | $23 | $31,700 | $4,100 | $27,600 |
| 2023 | $1,957 | $27,500 | $4,100 | $23,400 |
| 2022 | $1,789 | $24,400 | $3,700 | $20,700 |
| 2021 | $1,748 | $22,000 | $4,000 | $18,000 |
| 2020 | $1,735 | $21,500 | $4,000 | $17,500 |
| 2019 | $1,674 | $21,000 | $4,000 | $17,000 |
| 2018 | $1,227 | $20,000 | $4,000 | $16,000 |
| 2017 | $1,174 | $20,000 | $4,000 | $16,000 |
| 2016 | $1,134 | $19,700 | $4,000 | $15,700 |
| 2015 | $1,134 | $19,400 | $7,999 | $11,401 |
| 2014 | $1,134 | $19,300 | $5,999 | $13,301 |
Source: Public Records
Map
Nearby Homes
- 1204 Shepard St
- 1225 Regent St
- 1128 Lathrop St
- 1019 Dakin St
- 1200 S Holmes St
- 727 S Magnolia Ave
- 701 S Fairview Ave
- 637 S Clemens Ave
- 607 Shepard St Unit 2
- 910 S Holmes St
- 624 S Hayford Ave
- 528 S Fairview Ave
- 517 S Clemens Ave
- 1212 Climax St
- 515 S Clemens Ave
- 523 Clifford St
- 1620 Clifton Ave
- 629 S Foster Ave
- 1201 Climax St
- 0 E Mount Hope Ave
- 1216 Leslie St
- 1226 Leslie St
- 1212 Leslie St
- 211 Shepard St
- 1232 Leslie St
- 1219 Shepard St
- 1227 Shepard St
- 1206 Leslie St
- 1215 Shepard St
- 1211 Shepard St
- 1231 Shepard St
- 1229 Leslie St
- 1223 Leslie St
- 1225 Leslie St
- 1213 Leslie St
- 1238 Leslie St
- 1207 Shepard St
- 1200 Leslie St
- 1211 Leslie St
- 1235 Shepard St