Estimated Value: $138,000 - $183,000
3
Beds
1
Bath
871
Sq Ft
$178/Sq Ft
Est. Value
About This Home
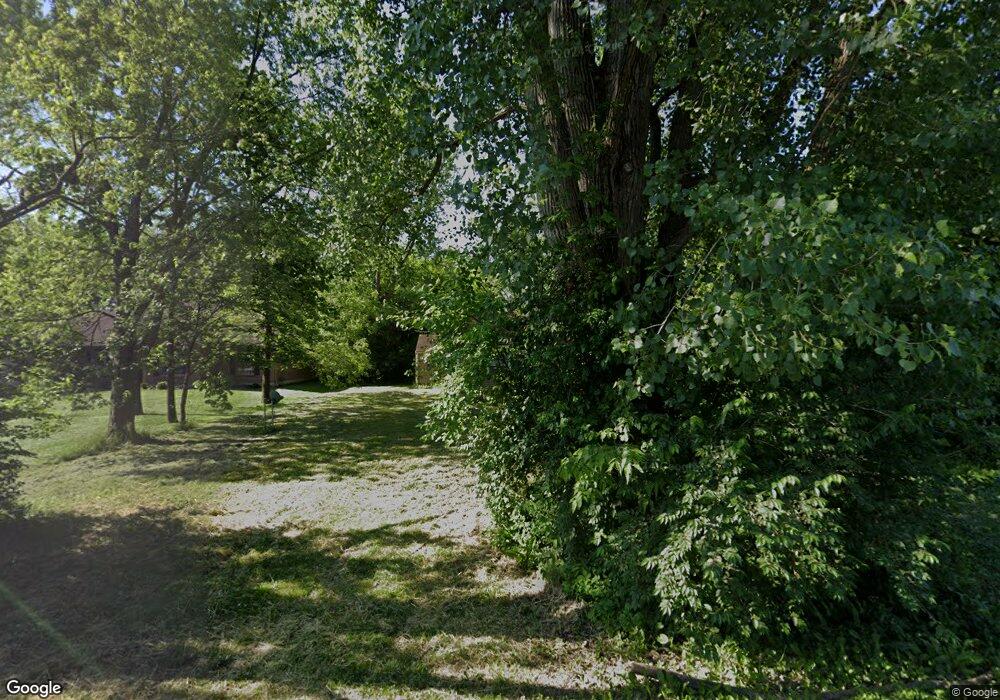
This home is located at 1218 Maple St, Troy, OH 45373 and is currently estimated at $154,817, approximately $177 per square foot. 1218 Maple St is a home located in Miami County with nearby schools including Heywood Elementary School, Van Cleve Elementary School, and Troy Junior High School.
Ownership History
Date
Name
Owned For
Owner Type
Purchase Details
Closed on
May 28, 2008
Sold by
Lasalle Bank Na
Bought by
Wright Steve and Wright Donna
Current Estimated Value
Purchase Details
Closed on
Dec 3, 2007
Sold by
Heisey David and Heisey Deborah
Bought by
Lasalle Bank Na and Bear Stearns Asset Backed Securities I L
Purchase Details
Closed on
Apr 6, 2005
Sold by
Rousseau Deborah A and Heisey Deborah
Bought by
Heisey David and Heisey Deborah
Purchase Details
Closed on
Jul 30, 2002
Sold by
Welch Steven and Welch Barbara
Bought by
Rousseau Deborah A
Home Financials for this Owner
Home Financials are based on the most recent Mortgage that was taken out on this home.
Original Mortgage
$66,431
Interest Rate
6.8%
Mortgage Type
FHA
Purchase Details
Closed on
Nov 2, 1994
Sold by
Dunavent Alan C
Bought by
Welch Steven and Welch Barbara
Create a Home Valuation Report for This Property
The Home Valuation Report is an in-depth analysis detailing your home's value as well as a comparison with similar homes in the area
Home Values in the Area
Average Home Value in this Area
Purchase History
| Date | Buyer | Sale Price | Title Company |
|---|---|---|---|
| Wright Steve | $29,501 | -- | |
| Lasalle Bank Na | -- | -- | |
| Heisey David | -- | -- | |
| Rousseau Deborah A | $67,000 | -- | |
| Welch Steven | $49,500 | -- |
Source: Public Records
Mortgage History
| Date | Status | Borrower | Loan Amount |
|---|---|---|---|
| Previous Owner | Rousseau Deborah A | $66,431 | |
| Closed | Welch Steven | -- |
Source: Public Records
Tax History Compared to Growth
Tax History
| Year | Tax Paid | Tax Assessment Tax Assessment Total Assessment is a certain percentage of the fair market value that is determined by local assessors to be the total taxable value of land and additions on the property. | Land | Improvement |
|---|---|---|---|---|
| 2024 | $922 | $23,170 | $7,350 | $15,820 |
| 2023 | $922 | $23,170 | $7,350 | $15,820 |
| 2022 | $776 | $23,170 | $7,350 | $15,820 |
| 2021 | $690 | $19,330 | $6,130 | $13,200 |
| 2020 | $691 | $19,330 | $6,130 | $13,200 |
| 2019 | $697 | $19,330 | $6,130 | $13,200 |
| 2018 | $478 | $12,600 | $6,370 | $6,230 |
| 2017 | $482 | $12,600 | $6,370 | $6,230 |
| 2016 | $476 | $12,600 | $6,370 | $6,230 |
| 2015 | $476 | $12,120 | $6,130 | $5,990 |
| 2014 | $476 | $12,120 | $6,130 | $5,990 |
| 2013 | $479 | $12,120 | $6,130 | $5,990 |
Source: Public Records
Map
Nearby Homes