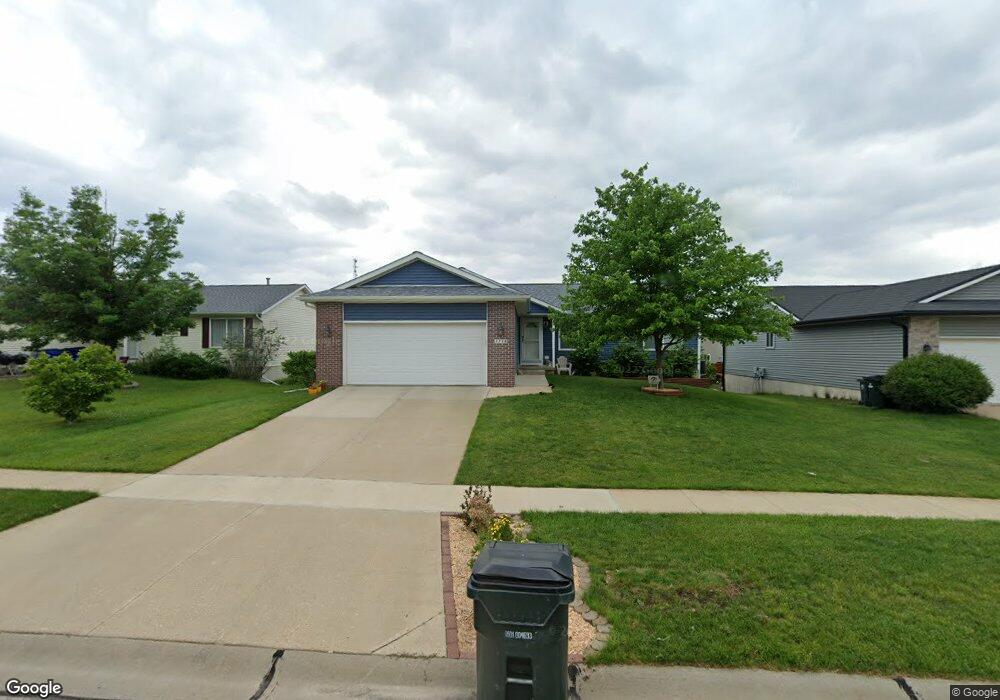
1218 Moose Dr NW Cedar Rapids, IA 52405
Estimated Value: $255,000 - $309,000
3
Beds
2
Baths
1,375
Sq Ft
$211/Sq Ft
Est. Value
About This Home
This home is located at 1218 Moose Dr NW, Cedar Rapids, IA 52405 and is currently estimated at $290,646, approximately $211 per square foot. 1218 Moose Dr NW is a home located in Linn County with nearby schools including Maple Grove Elementary School, North Middletown Elementary School, and Ponderosa Elementary School.
Ownership History
Date
Name
Owned For
Owner Type
Purchase Details
Closed on
Dec 14, 2010
Sold by
Norton Trenton J and Norton Tereca K
Bought by
Peck Jason and Peck Amie M
Current Estimated Value
Home Financials for this Owner
Home Financials are based on the most recent Mortgage that was taken out on this home.
Original Mortgage
$126,720
Outstanding Balance
$80,602
Interest Rate
3.5%
Mortgage Type
Adjustable Rate Mortgage/ARM
Estimated Equity
$210,044
Purchase Details
Closed on
Jan 13, 2003
Sold by
Kacs Lc
Bought by
Norton Trenton J and Norton Tereca K
Home Financials for this Owner
Home Financials are based on the most recent Mortgage that was taken out on this home.
Original Mortgage
$130,700
Interest Rate
6.13%
Purchase Details
Closed on
May 13, 1999
Sold by
Selk Robert
Bought by
Selk Donna L
Create a Home Valuation Report for This Property
The Home Valuation Report is an in-depth analysis detailing your home's value as well as a comparison with similar homes in the area
Home Values in the Area
Average Home Value in this Area
Purchase History
| Date | Buyer | Sale Price | Title Company |
|---|---|---|---|
| Peck Jason | $158,000 | None Available | |
| Norton Trenton J | $163,000 | -- | |
| Selk Donna L | -- | -- |
Source: Public Records
Mortgage History
| Date | Status | Borrower | Loan Amount |
|---|---|---|---|
| Open | Peck Jason | $126,720 | |
| Previous Owner | Norton Trenton J | $130,700 | |
| Closed | Norton Trenton J | $32,675 |
Source: Public Records
Tax History Compared to Growth
Tax History
| Year | Tax Paid | Tax Assessment Tax Assessment Total Assessment is a certain percentage of the fair market value that is determined by local assessors to be the total taxable value of land and additions on the property. | Land | Improvement |
|---|---|---|---|---|
| 2025 | $4,710 | $301,000 | $58,200 | $242,800 |
| 2024 | $4,768 | $276,600 | $54,900 | $221,700 |
| 2023 | $4,768 | $276,600 | $54,900 | $221,700 |
| 2022 | $4,410 | $234,900 | $48,300 | $186,600 |
| 2021 | $4,464 | $221,800 | $41,600 | $180,200 |
| 2020 | $4,464 | $210,900 | $41,600 | $169,300 |
| 2019 | $3,944 | $191,500 | $33,300 | $158,200 |
| 2018 | $3,830 | $191,500 | $33,300 | $158,200 |
| 2017 | $3,909 | $185,500 | $33,300 | $152,200 |
| 2016 | $3,909 | $183,900 | $33,300 | $150,600 |
| 2015 | $4,091 | $192,225 | $33,278 | $158,947 |
| 2014 | $3,906 | $192,225 | $33,278 | $158,947 |
| 2013 | $4,002 | $192,225 | $33,278 | $158,947 |
Source: Public Records
Map
Nearby Homes
- 1722 Gardner Dr NW
- 1608 Morris Ave NW
- 4819 Fruitwood Ln NW
- 3802 Richland Dr NW
- 327* Edgewood Rd NW
- 3313 Crestwood Dr NW
- 4819 Ford Ave NW
- 272 Peace Ave NW
- 281 Jacolyn Dr NW
- 3312 G Ave NW
- 1613 Southview Dr NW
- 3507 E Ave NW Unit F
- 3509 E Ave NW Unit D
- 208 Lenora Dr NW
- 4975 Kesler Rd NW
- 1322 Woodside Dr NW
- 1733 Hillside Dr NW
- 229 Jacolyn Dr NW
- 1410 Adair Ct SW Unit Lot 2
- 3600 Midway Dr NW
- 1224 Moose Dr NW
- 1212 Moose Dr NW
- 1223 Wolf Dr NW
- 1206 Moose Dr NW
- 1229 Wolf Dr NW
- 1211 Wolf Dr NW
- 1219 Moose Dr NW
- 1200 Moose Dr NW
- 1225 Moose Dr NW
- 1213 Moose Dr NW
- 4520 M Ave NW
- 1205 Wolf Dr NW
- 1301 Wolf Dr NW
- 1207 Moose Dr NW
- 4514 M Ave NW
- 1126 Moose Dr NW
- 4508 M Ave NW
- 1201 Moose Dr NW
- 1311 Wolf Dr NW
- 1220 Wolf Dr NW