Estimated Value: $739,000 - $792,000
3
Beds
3
Baths
2,192
Sq Ft
$349/Sq Ft
Est. Value
About This Home
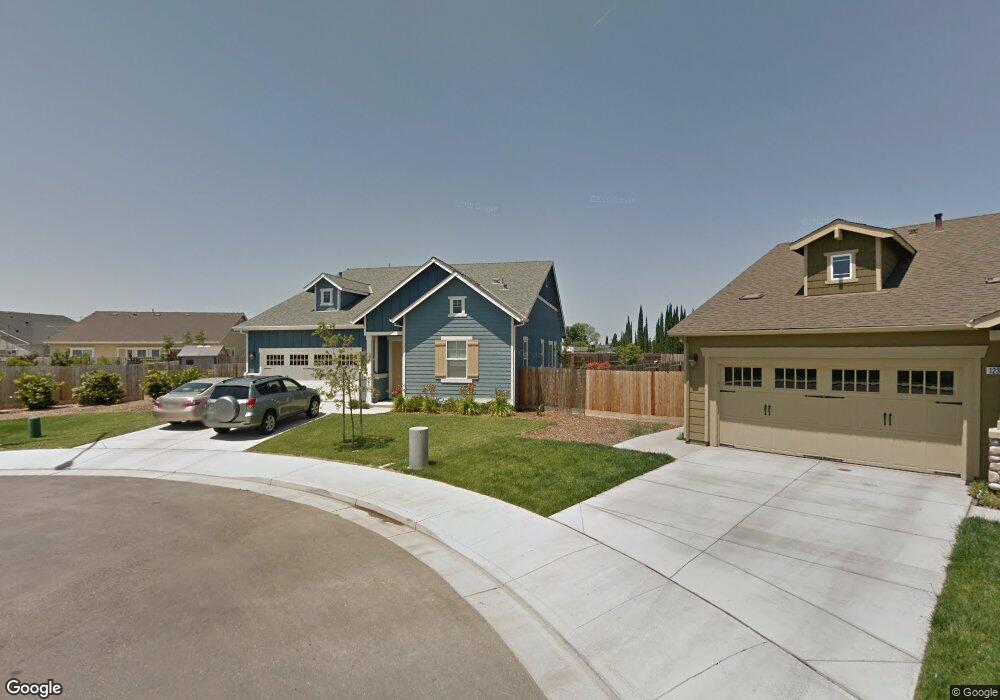
This home is located at 1218 Muir Ct, Tracy, CA 95304 and is currently estimated at $765,803, approximately $349 per square foot. 1218 Muir Ct is a home located in San Joaquin County with nearby schools including Louis A. Bohn Elementary School, Earle E. Williams Middle School, and Tracy High School.
Ownership History
Date
Name
Owned For
Owner Type
Purchase Details
Closed on
Aug 26, 2024
Sold by
Debra M Westhafer-Schoonmaker Living Tru and Schoonmaker Rachel
Bought by
Schoonmaker Rachel
Current Estimated Value
Purchase Details
Closed on
May 3, 2024
Sold by
Westhafer-Schoonmaker Debra M
Bought by
Debra M Westhafer-Schoonmaker Living Trust and Westhafer-Schoonmaker
Purchase Details
Closed on
May 19, 2010
Sold by
Bright Development
Bought by
Schoonmaker Victor A and Westhafer Schoonmaker Debra M
Home Financials for this Owner
Home Financials are based on the most recent Mortgage that was taken out on this home.
Original Mortgage
$125,000
Interest Rate
5.05%
Mortgage Type
New Conventional
Purchase Details
Closed on
Sep 12, 2006
Sold by
Bright Cheryl V and Marjorie H Bright Trust
Bought by
Bright Development
Create a Home Valuation Report for This Property
The Home Valuation Report is an in-depth analysis detailing your home's value as well as a comparison with similar homes in the area
Home Values in the Area
Average Home Value in this Area
Purchase History
| Date | Buyer | Sale Price | Title Company |
|---|---|---|---|
| Schoonmaker Rachel | -- | None Listed On Document | |
| Debra M Westhafer-Schoonmaker Living Trust | -- | None Listed On Document | |
| Schoonmaker Victor A | $382,000 | Stewart Title Of California | |
| Bright Development | -- | North American Title Co | |
| Bright Development | -- | North American Title Co | |
| Bright Development | -- | North American Title Co |
Source: Public Records
Mortgage History
| Date | Status | Borrower | Loan Amount |
|---|---|---|---|
| Previous Owner | Schoonmaker Victor A | $125,000 |
Source: Public Records
Tax History Compared to Growth
Tax History
| Year | Tax Paid | Tax Assessment Tax Assessment Total Assessment is a certain percentage of the fair market value that is determined by local assessors to be the total taxable value of land and additions on the property. | Land | Improvement |
|---|---|---|---|---|
| 2025 | $7,110 | $493,055 | $122,620 | $370,435 |
| 2024 | $7,211 | $483,388 | $120,216 | $363,172 |
| 2023 | $7,075 | $473,910 | $117,859 | $356,051 |
| 2022 | $6,936 | $464,619 | $115,549 | $349,070 |
| 2021 | $6,823 | $455,510 | $113,284 | $342,226 |
| 2020 | $6,757 | $450,840 | $112,123 | $338,717 |
| 2019 | $6,566 | $442,001 | $109,925 | $332,076 |
| 2018 | $6,382 | $433,335 | $107,770 | $325,565 |
| 2017 | $6,179 | $424,839 | $105,657 | $319,182 |
| 2016 | $6,209 | $416,512 | $103,586 | $312,926 |
| 2014 | $5,936 | $402,226 | $100,033 | $302,193 |
Source: Public Records
Map
Nearby Homes
- 1867 Crater Place
- 1242 Tulloch Dr
- 1123 David Senft Ln
- 145 Eureka Way
- 693 Nacomis Ct
- 2417 Stalsburg Dr
- 55 Carmel Way
- 484 S Derone Ln
- 155 Loma Prieta Cir
- Residence Two Plan at Ashley Park
- Residence One Plan at Ashley Park
- 2662 Pyramid Dr
- 890 Winnipeg Ct
- 56 Lavender Ct
- 1521 Biarritz St
- 55 Shakespear Ct
- 345 Pacheco Dr
- 1990 Earl Way
- 85 Phillips Ct
- 521 Leamon St
- 1238 Muir Ct
- 1226 Tenaya Ct
- 1217 Muir Ct
- 1256 Tenaya Ct
- 1258 Muir Ct
- 779 Yosemite Dr
- 749 Yosemite Dr
- 1225 Tenaya Ct
- 1287 Muir Ct
- 1397 Sentinel Dr
- 729 Yosemite Dr
- 1278 Muir Ct
- 1417 Sentinel Dr
- 1245 Tenaya Ct
- 1285 Tenaya Ct
- 8818 Janice Way
- 847 Sentinel Dr
- 770 Yosemite Dr
- 1378 Sentinel Dr
- 750 Yosemite Dr