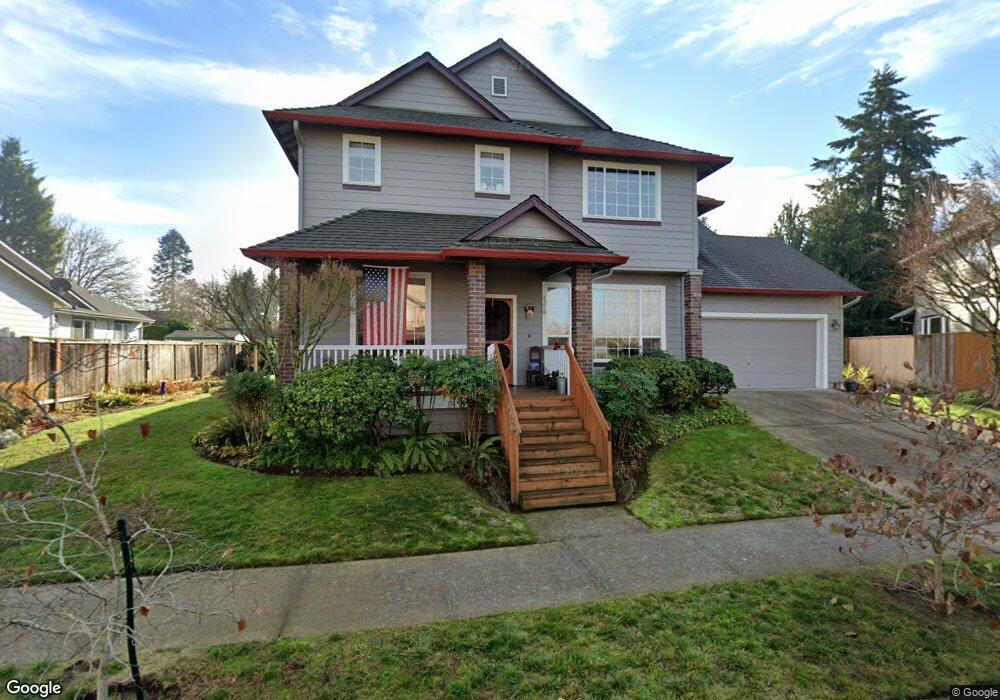
1218 NE Cedar Ridge Loop Vancouver, WA 98664
North Garrison Heights NeighborhoodEstimated Value: $637,000 - $689,000
4
Beds
3
Baths
2,478
Sq Ft
$266/Sq Ft
Est. Value
About This Home
This home is located at 1218 NE Cedar Ridge Loop, Vancouver, WA 98664 and is currently estimated at $660,362, approximately $266 per square foot. 1218 NE Cedar Ridge Loop is a home located in Clark County with nearby schools including Marrion Elementary School, Wyeast Middle School, and Mountain View High School.
Ownership History
Date
Name
Owned For
Owner Type
Purchase Details
Closed on
Mar 9, 2005
Sold by
Ellis Melanie A and Ellis Richard A
Bought by
Cory Alvera M and Perez Milton
Current Estimated Value
Purchase Details
Closed on
Sep 26, 2001
Sold by
Mccoog Phillip A and Mccoog Carol J
Bought by
Ellis Richard A and Ellis Melanie A
Home Financials for this Owner
Home Financials are based on the most recent Mortgage that was taken out on this home.
Original Mortgage
$183,920
Interest Rate
6.91%
Purchase Details
Closed on
Jul 14, 1999
Sold by
Schuler Homes Of Washington Inc
Bought by
Mccoog Phillip A and Mccoog Carol J
Home Financials for this Owner
Home Financials are based on the most recent Mortgage that was taken out on this home.
Original Mortgage
$177,550
Interest Rate
7.51%
Create a Home Valuation Report for This Property
The Home Valuation Report is an in-depth analysis detailing your home's value as well as a comparison with similar homes in the area
Home Values in the Area
Average Home Value in this Area
Purchase History
| Date | Buyer | Sale Price | Title Company |
|---|---|---|---|
| Cory Alvera M | $299,900 | Chicago Title Insurance | |
| Ellis Richard A | $229,900 | Chicago Title Insurance | |
| Mccoog Phillip A | $221,960 | Transnation Title Insurance |
Source: Public Records
Mortgage History
| Date | Status | Borrower | Loan Amount |
|---|---|---|---|
| Previous Owner | Ellis Richard A | $183,920 | |
| Previous Owner | Mccoog Phillip A | $177,550 |
Source: Public Records
Tax History Compared to Growth
Tax History
| Year | Tax Paid | Tax Assessment Tax Assessment Total Assessment is a certain percentage of the fair market value that is determined by local assessors to be the total taxable value of land and additions on the property. | Land | Improvement |
|---|---|---|---|---|
| 2025 | $5,619 | $594,838 | $189,750 | $405,088 |
| 2024 | $5,405 | $566,574 | $189,750 | $376,824 |
| 2023 | $5,502 | $565,449 | $191,400 | $374,049 |
| 2022 | $4,980 | $568,705 | $191,400 | $377,305 |
| 2021 | $4,829 | $488,192 | $165,000 | $323,192 |
| 2020 | $4,611 | $447,316 | $129,096 | $318,220 |
| 2019 | $4,063 | $431,189 | $107,580 | $323,609 |
| 2018 | $4,557 | $409,164 | $0 | $0 |
| 2017 | $4,021 | $368,909 | $0 | $0 |
| 2016 | $3,823 | $336,990 | $0 | $0 |
| 2015 | $3,859 | $306,823 | $0 | $0 |
| 2014 | -- | $296,098 | $0 | $0 |
| 2013 | -- | $261,803 | $0 | $0 |
Source: Public Records
Map
Nearby Homes
- 9008 NE 11th St
- 8803 NE 14th St
- 1411 NE 90th Ave
- 1604 NE 91st Ave
- 8405 NE 10th St
- 8702 NE 17th St Unit 61
- 1007 NE 82nd Ave
- 9511 NE Pinecreek St
- 9818 NE 14th St
- 604 NE 98th Ct
- 8009 NE 16th St
- 1007 NE 100th Ave
- 622 NE 100th Ave
- 9910 NE 15th St
- 1421 NE 100th Ave
- 2016 NE 87th Ave
- 300 Baltimore Way
- 700 Garrison Terrace
- 2017 NE 96th Ct
- 2305 NE 94th Ct
- 1220 NE Cedar Ridge Loop
- 1216 NE Cedar Ridge Loop
- 9002 NE 11th St
- 8916 NE 11th St
- 1217 NE Cedar Ridge Loop
- 1214 NE Cedar Ridge Loop
- 1222 NE Cedar Ridge Loop
- 1221 NE Cedar Ridge Loop
- 1103 NE 89th Ave
- 1105 NE 89th Ave
- 1212 NE Cedar Ridge Loop
- 9016 NE 11th St
- 1101 NE 89th Ave
- 1227 NE Cedar Ridge Loop
- 8917 NE 11th St
- 1224 NE Cedar Ridge Loop
- 1113 NE 89th Ave
- 1205 NE Cedar Ridge Loop
- 9007 NE 11th St
- 1209 NE Cedar Ridge Loop