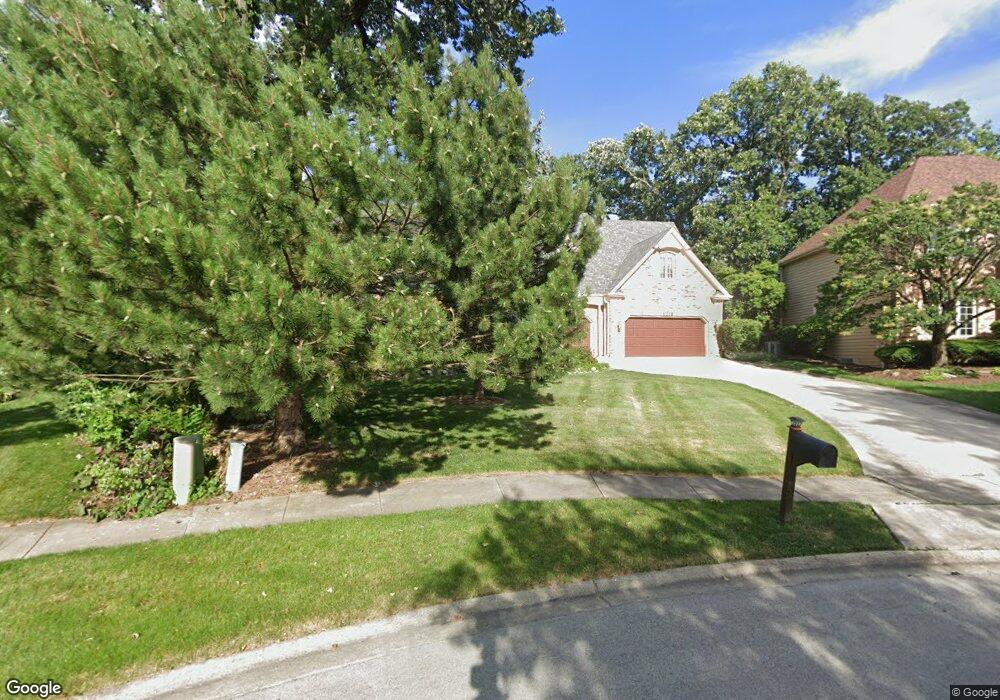
1218 Olesen Dr Naperville, IL 60540
Huntington Hill NeighborhoodEstimated Value: $911,018 - $1,219,000
5
Beds
4
Baths
3,594
Sq Ft
$281/Sq Ft
Est. Value
About This Home
This home is located at 1218 Olesen Dr, Naperville, IL 60540 and is currently estimated at $1,009,005, approximately $280 per square foot. 1218 Olesen Dr is a home located in DuPage County with nearby schools including Highlands Elementary School, Kennedy Junior High School, and Naperville North High School.
Ownership History
Date
Name
Owned For
Owner Type
Purchase Details
Closed on
Sep 18, 2008
Sold by
Carey Robert F and Carey Laura A
Bought by
Chen Ying Gang and Hu Jing Lei
Current Estimated Value
Home Financials for this Owner
Home Financials are based on the most recent Mortgage that was taken out on this home.
Original Mortgage
$483,000
Outstanding Balance
$296,984
Interest Rate
5%
Mortgage Type
Purchase Money Mortgage
Estimated Equity
$712,021
Purchase Details
Closed on
May 30, 2000
Sold by
Wilson Alexander Derek and Wilson Noelene
Bought by
Carey Robert F and Carey Laura A
Home Financials for this Owner
Home Financials are based on the most recent Mortgage that was taken out on this home.
Original Mortgage
$439,900
Interest Rate
7.75%
Create a Home Valuation Report for This Property
The Home Valuation Report is an in-depth analysis detailing your home's value as well as a comparison with similar homes in the area
Home Values in the Area
Average Home Value in this Area
Purchase History
| Date | Buyer | Sale Price | Title Company |
|---|---|---|---|
| Chen Ying Gang | $690,000 | Multiple | |
| Carey Robert F | $550,000 | -- |
Source: Public Records
Mortgage History
| Date | Status | Borrower | Loan Amount |
|---|---|---|---|
| Open | Chen Ying Gang | $483,000 | |
| Previous Owner | Carey Robert F | $439,900 |
Source: Public Records
Tax History Compared to Growth
Tax History
| Year | Tax Paid | Tax Assessment Tax Assessment Total Assessment is a certain percentage of the fair market value that is determined by local assessors to be the total taxable value of land and additions on the property. | Land | Improvement |
|---|---|---|---|---|
| 2024 | $14,005 | $236,616 | $93,901 | $142,715 |
| 2023 | $13,512 | $215,950 | $85,700 | $130,250 |
| 2022 | $13,314 | $211,720 | $84,020 | $127,700 |
| 2021 | $12,833 | $203,710 | $80,840 | $122,870 |
| 2020 | $12,563 | $200,050 | $79,390 | $120,660 |
| 2019 | $12,203 | $191,400 | $75,960 | $115,440 |
| 2018 | $12,207 | $191,400 | $75,960 | $115,440 |
| 2017 | $12,398 | $191,400 | $75,960 | $115,440 |
| 2016 | $12,627 | $191,390 | $75,950 | $115,440 |
| 2015 | $12,559 | $180,230 | $71,520 | $108,710 |
| 2014 | $12,968 | $180,230 | $71,520 | $108,710 |
| 2013 | $12,773 | $180,660 | $71,690 | $108,970 |
Source: Public Records
Map
Nearby Homes
- 8S452 Bell Dr
- 907 Secretariat Dr
- 923 Tim Tam Cir
- 1408 Swallow St
- 1449 Whitespire Ct Unit 5104
- 908 Julian Ct
- 1006 Bankfield Ct
- 165 Tamarack Ave
- 625 Edward Rd
- 616 Driftwood Ct
- 1300 Old Dominion Rd
- 1216 Tranquility Ct
- 128 E Bailey Rd Unit G
- 158 E Bailey Rd Unit F
- 213 Winding Creek Dr
- 138 E Bailey Rd Unit M
- 821 Wellner Rd
- 1751 S Washington St Unit 1
- 1386 Old Dominion Ct
- 621 Bourbon Ct
- 1222 Olesen Dr
- 1214 Olesen Dr
- 25W636 Hobson Rd
- 1226 Olesen Dr
- 1230 Olesen Dr
- 25W630 Hobson Rd
- 1196 Hobson Mill Dr
- 1192 Hobson Mill Dr
- 1219 Olesen Dr
- 8S180 Olesen Dr
- 940 Norwood Ct
- 1188 Hobson Mill Dr Unit 1
- 1199 Hobson Mill Dr
- 727 Saddlers Ct
- 1195 Hobson Mill Dr
- 1191 Hobson Mill Dr
- 1216 Oxford Ln
- 732 Saddlers Ct
- 932 Norwood Ct
- 731 Saddlers Ct