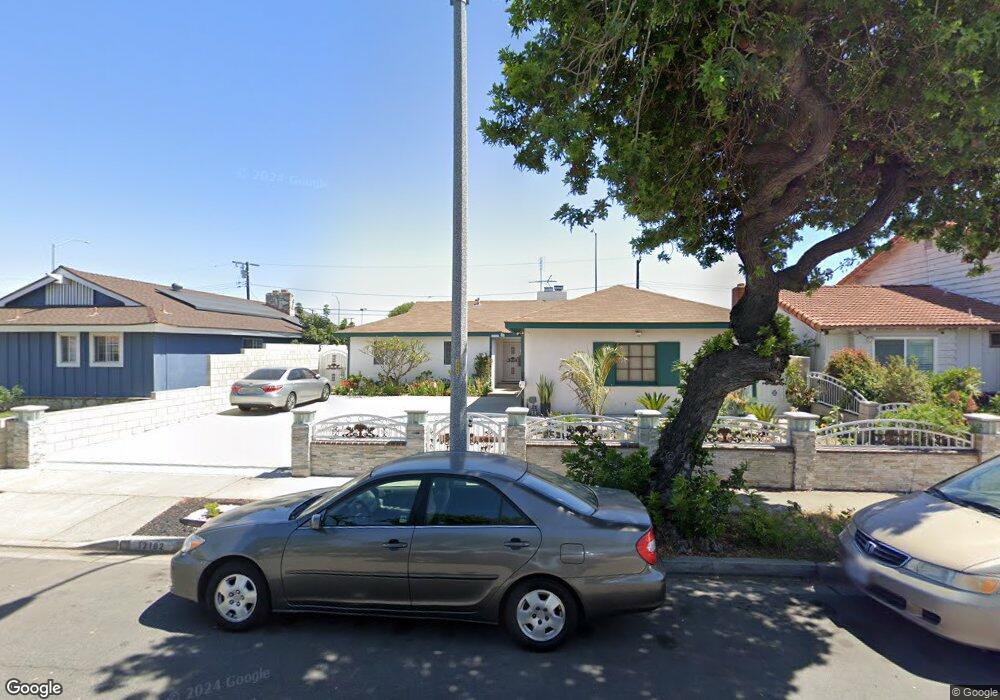
12182 Pearce Ave Garden Grove, CA 92843
Estimated Value: $908,000 - $1,235,000
3
Beds
3
Baths
1,650
Sq Ft
$642/Sq Ft
Est. Value
About This Home
This home is located at 12182 Pearce Ave, Garden Grove, CA 92843 and is currently estimated at $1,059,397, approximately $642 per square foot. 12182 Pearce Ave is a home located in Orange County with nearby schools including Dwight D. Eisenhower Elementary School, Izaak Walton Intermediate School, and Santiago High School.
Ownership History
Date
Name
Owned For
Owner Type
Purchase Details
Closed on
Jan 31, 2002
Sold by
Nguyen Anhhong Thi
Bought by
Lam Minh Brian
Current Estimated Value
Home Financials for this Owner
Home Financials are based on the most recent Mortgage that was taken out on this home.
Original Mortgage
$247,500
Outstanding Balance
$114,138
Interest Rate
8.87%
Estimated Equity
$945,259
Purchase Details
Closed on
Jan 18, 2002
Sold by
Tran Simon Truong and Tran Truong Nhat
Bought by
Lam Minh Brian
Home Financials for this Owner
Home Financials are based on the most recent Mortgage that was taken out on this home.
Original Mortgage
$247,500
Outstanding Balance
$114,138
Interest Rate
8.87%
Estimated Equity
$945,259
Purchase Details
Closed on
Jan 15, 2002
Sold by
Le Tracy Phuong
Bought by
Tran Simon Truong
Home Financials for this Owner
Home Financials are based on the most recent Mortgage that was taken out on this home.
Original Mortgage
$247,500
Outstanding Balance
$114,138
Interest Rate
8.87%
Estimated Equity
$945,259
Create a Home Valuation Report for This Property
The Home Valuation Report is an in-depth analysis detailing your home's value as well as a comparison with similar homes in the area
Home Values in the Area
Average Home Value in this Area
Purchase History
| Date | Buyer | Sale Price | Title Company |
|---|---|---|---|
| Lam Minh Brian | -- | Stewart Title | |
| Lam Minh Brian | $275,000 | Stewart Title | |
| Tran Simon Truong | -- | Stewart Title |
Source: Public Records
Mortgage History
| Date | Status | Borrower | Loan Amount |
|---|---|---|---|
| Open | Lam Minh Brian | $247,500 |
Source: Public Records
Tax History Compared to Growth
Tax History
| Year | Tax Paid | Tax Assessment Tax Assessment Total Assessment is a certain percentage of the fair market value that is determined by local assessors to be the total taxable value of land and additions on the property. | Land | Improvement |
|---|---|---|---|---|
| 2025 | $5,104 | $406,244 | $285,601 | $120,643 |
| 2024 | $5,104 | $398,279 | $280,001 | $118,278 |
| 2023 | $5,008 | $390,470 | $274,511 | $115,959 |
| 2022 | $4,896 | $382,814 | $269,128 | $113,686 |
| 2021 | $4,827 | $375,308 | $263,851 | $111,457 |
| 2020 | $4,768 | $371,460 | $261,145 | $110,315 |
| 2019 | $4,703 | $364,177 | $256,025 | $108,152 |
| 2018 | $4,588 | $357,037 | $251,005 | $106,032 |
| 2017 | $4,539 | $350,037 | $246,084 | $103,953 |
| 2016 | $4,314 | $343,174 | $241,259 | $101,915 |
| 2015 | $4,257 | $338,020 | $237,635 | $100,385 |
| 2014 | $4,157 | $331,399 | $232,980 | $98,419 |
Source: Public Records
Map
Nearby Homes
- 13111 Rainbow St
- 12152 Trask Ave Unit 29
- 12342 Quartz Place
- 13096 Blackbird St Unit 67
- 13096 Blackbird St Unit 164
- 13096 Blackbird St Unit 11
- 13096 Blackbird St Unit 82
- 13102 Partridge St Unit 7
- 13102 Partridge St Unit 54
- 12905 Palm St
- 12681 Trask Ave
- 12850 Palm St Unit 6
- 13052 Rockinghorse Rd
- 12842 Palm St Unit 108
- 12842 Palm St Unit 204
- 12842 Palm St Unit 301
- 12848 Timber Rd Unit 33
- 13431 Lilly St
- 12812 Timber Rd Unit 22
- 12512 Tours Ave
- 12192 Pearce Ave
- 12172 Pearce Ave
- 12162 Pearce Ave
- 12212 Pearce Ave
- 12171 Pearce Ave
- 12152 Pearce Ave
- 12222 Pearce Ave
- 12161 Pearce Ave
- 12181 Pearce Ave
- 12191 Pearce Ave
- 12142 Pearce Ave
- 12211 Pearce Ave
- 13282 Rainbow St
- 12232 Pearce Ave
- 13272 Rainbow St
- 12221 Pearce Ave
- 12132 Pearce Ave
- 12242 Pearce Ave
- 12231 Pearce Ave
- 12182 Flint Cir