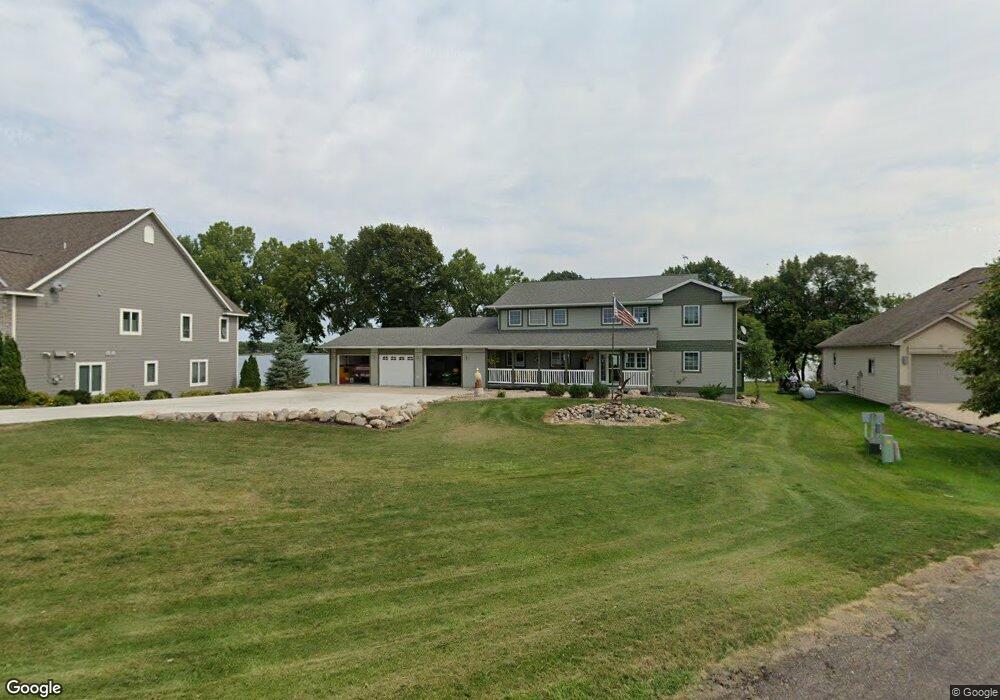
12189 Maple Springs Dr SE Alexandria, MN 56308
Estimated Value: $944,000 - $1,072,491
5
Beds
4
Baths
4,443
Sq Ft
$223/Sq Ft
Est. Value
About This Home
This home is located at 12189 Maple Springs Dr SE, Alexandria, MN 56308 and is currently estimated at $990,873, approximately $223 per square foot. 12189 Maple Springs Dr SE is a home located in Douglas County with nearby schools including Woodland Elementary School, Discovery Middle School, and Alexandria Area High School.
Ownership History
Date
Name
Owned For
Owner Type
Purchase Details
Closed on
Jul 10, 2023
Sold by
Carlson Lynn and Carlson Robin
Bought by
Lynn A Carlson Living Trust and Robin L Carlson Living Trust
Current Estimated Value
Purchase Details
Closed on
Sep 30, 2016
Sold by
Polasky Jonathan R and Polasky Marcine
Bought by
Carlson Lynn and Carlson Robin
Home Financials for this Owner
Home Financials are based on the most recent Mortgage that was taken out on this home.
Original Mortgage
$643,000
Interest Rate
3.46%
Mortgage Type
Commercial
Purchase Details
Closed on
Nov 30, 2009
Sold by
Behlmen Terrece R and Behlmen Evelyn A
Bought by
Polasky Jonathan R and Ellwein Marcine P
Home Financials for this Owner
Home Financials are based on the most recent Mortgage that was taken out on this home.
Original Mortgage
$417,000
Interest Rate
4.95%
Mortgage Type
New Conventional
Create a Home Valuation Report for This Property
The Home Valuation Report is an in-depth analysis detailing your home's value as well as a comparison with similar homes in the area
Home Values in the Area
Average Home Value in this Area
Purchase History
| Date | Buyer | Sale Price | Title Company |
|---|---|---|---|
| Lynn A Carlson Living Trust | $3,000 | None Listed On Document | |
| Carlson Lynn | $633,252 | Integrity Title | |
| Polasky Jonathan R | $615,000 | None Available |
Source: Public Records
Mortgage History
| Date | Status | Borrower | Loan Amount |
|---|---|---|---|
| Previous Owner | Carlson Lynn | $643,000 | |
| Previous Owner | Polasky Jonathan R | $417,000 |
Source: Public Records
Tax History Compared to Growth
Tax History
| Year | Tax Paid | Tax Assessment Tax Assessment Total Assessment is a certain percentage of the fair market value that is determined by local assessors to be the total taxable value of land and additions on the property. | Land | Improvement |
|---|---|---|---|---|
| 2025 | $8,740 | $1,001,900 | $230,200 | $771,700 |
| 2024 | $8,740 | $960,900 | $220,300 | $740,600 |
| 2023 | $8,944 | $925,800 | $210,400 | $715,400 |
| 2022 | $8,072 | $827,300 | $210,400 | $616,900 |
| 2021 | $8,008 | $734,900 | $200,500 | $534,400 |
| 2020 | $8,020 | $708,400 | $198,000 | $510,400 |
| 2019 | $7,554 | $692,900 | $195,600 | $497,300 |
| 2018 | $7,296 | $674,100 | $195,600 | $478,500 |
| 2017 | $6,416 | $657,000 | $195,600 | $461,400 |
| 2016 | $6,690 | $592,476 | $189,732 | $402,744 |
| 2015 | $6,352 | $0 | $0 | $0 |
| 2014 | -- | $558,800 | $176,000 | $382,800 |
Source: Public Records
Map
Nearby Homes
- 13144 Maple Circle Dr SE
- 13150 Maple Circle Dr SE
- 10096 State Hwy 29 S
- XX5 Serenity Dr SW
- 8418 State Highway 29 S
- 8612 S Union Lake Dr SE Unit SE
- 3035 County Road 4 SW
- 8042 Meades Addn Dr SE
- 7870 Cottage Ln SW
- 7870 Cottage Ln SW Unit 19
- 7870 Cottage Ln SW Unit 28
- TBD 50th Ave W
- XXXX 50th Ave E
- 6553 Pennie Rd SE
- 5XXX W Lake Burgen Rd SE
- TBD 48th Ave
- TBD 44th Ave W
- 4605 Snowbird Ln SE
- 4516 Snowbird Ln SE
- 2502 Ranchwood Cir SE
- 12203 Maple Springs Dr SE
- 12175 Maple Springs Dr SE
- 12153 Maple Springs-Drive-se
- 12163 Maple Springs Dr SE
- 12215 Maple Springs Dr SE
- 12153 Maple Springs Dr SE
- 12188 Maple Springs Dr SE
- 12200 Maple Springs Dr SE
- 12151 Maple Springs Dr SE
- 12170 Maple Springs Dr SE
- 12224 Maple Springs Dr SE
- Lot 5 Maple Trail
- 12133 Maple Springs Dr SE
- 12148 Maple Springs Dr SE
- Lot 3 Maple Trail
- 388 Maple Trail SE
- 12095 Maple Springs Dr SE
- Lot 6 Maple Trail
- 372 Maple Trail SE
- Lot 2 Maple Trail