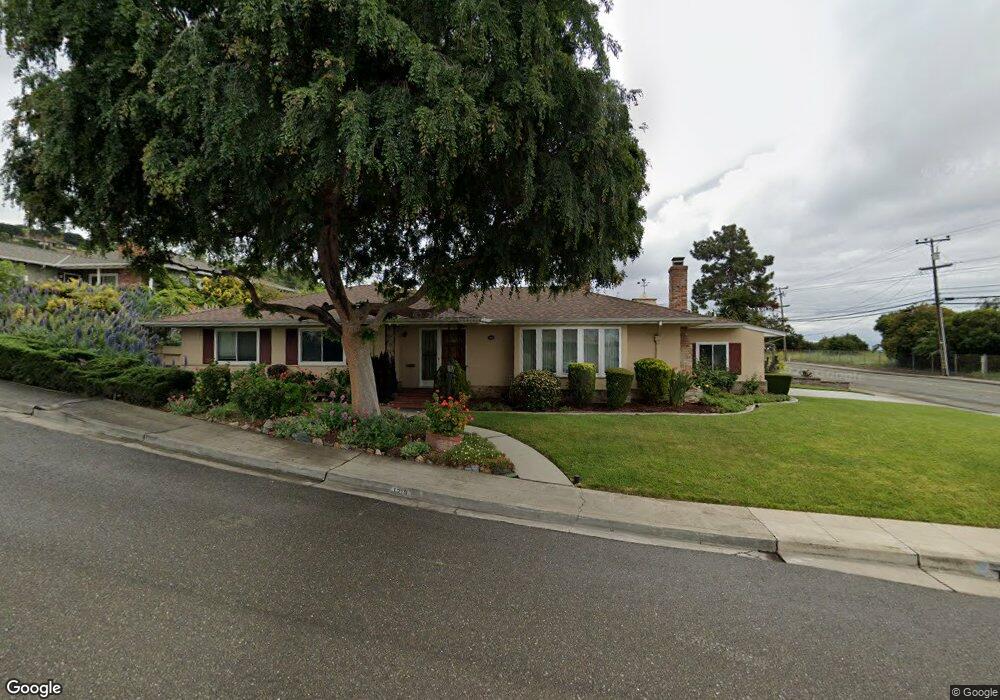
1219 Ardmore Dr San Leandro, CA 94577
Bay-O-Vista NeighborhoodEstimated Value: $982,000 - $1,204,000
3
Beds
2
Baths
1,669
Sq Ft
$648/Sq Ft
Est. Value
About This Home
This home is located at 1219 Ardmore Dr, San Leandro, CA 94577 and is currently estimated at $1,081,296, approximately $647 per square foot. 1219 Ardmore Dr is a home located in Alameda County with nearby schools including Roosevelt Elementary School, Bancroft Middle School, and San Leandro High School.
Ownership History
Date
Name
Owned For
Owner Type
Purchase Details
Closed on
Jan 12, 2000
Sold by
Dunn Othell and Dunn Maude M
Bought by
Slogar Rich J
Current Estimated Value
Home Financials for this Owner
Home Financials are based on the most recent Mortgage that was taken out on this home.
Original Mortgage
$263,200
Outstanding Balance
$83,562
Interest Rate
7.83%
Mortgage Type
Stand Alone First
Estimated Equity
$997,734
Purchase Details
Closed on
Jun 29, 1998
Sold by
Paschen Kenji
Bought by
Dunn Othell and Dunn Maude M
Home Financials for this Owner
Home Financials are based on the most recent Mortgage that was taken out on this home.
Original Mortgage
$219,450
Interest Rate
7.06%
Create a Home Valuation Report for This Property
The Home Valuation Report is an in-depth analysis detailing your home's value as well as a comparison with similar homes in the area
Home Values in the Area
Average Home Value in this Area
Purchase History
| Date | Buyer | Sale Price | Title Company |
|---|---|---|---|
| Slogar Rich J | $329,000 | American Title Co | |
| Dunn Othell | $231,000 | American Title Co |
Source: Public Records
Mortgage History
| Date | Status | Borrower | Loan Amount |
|---|---|---|---|
| Open | Slogar Rich J | $263,200 | |
| Previous Owner | Dunn Othell | $219,450 |
Source: Public Records
Tax History Compared to Growth
Tax History
| Year | Tax Paid | Tax Assessment Tax Assessment Total Assessment is a certain percentage of the fair market value that is determined by local assessors to be the total taxable value of land and additions on the property. | Land | Improvement |
|---|---|---|---|---|
| 2025 | $6,922 | $498,636 | $151,691 | $353,945 |
| 2024 | $6,922 | $488,723 | $148,717 | $347,006 |
| 2023 | $6,857 | $486,004 | $145,801 | $340,203 |
| 2022 | $6,666 | $469,477 | $142,943 | $333,534 |
| 2021 | $6,447 | $460,137 | $140,141 | $326,996 |
| 2020 | $6,270 | $462,350 | $138,705 | $323,645 |
| 2019 | $6,088 | $453,285 | $135,985 | $317,300 |
| 2018 | $5,924 | $444,400 | $133,320 | $311,080 |
| 2017 | $5,819 | $435,687 | $130,706 | $304,981 |
| 2016 | $5,519 | $427,147 | $128,144 | $299,003 |
| 2015 | $5,422 | $420,731 | $126,219 | $294,512 |
| 2014 | $5,376 | $412,490 | $123,747 | $288,743 |
Source: Public Records
Map
Nearby Homes
- 1293 Vistagrand Dr
- 2724 Benedict Dr
- 1876 Benedict Dr
- 2132 Longview Dr
- 2153 Lakeview Dr
- 2147 Trombas Ave
- 1468 Grand Ave Unit 9
- 1468 Grand Ave Unit 39
- 1468 Grand Ave Unit 21
- 1939 Placer Dr
- 856 Dolores Ave
- 14683 Midland Rd
- 1380 E Juana Ave
- 14101 E 14th St Unit 306
- 2290 Upland Rd
- 0 Saturn Dr
- 14625 Bancroft Ave
- 1253 139th Ave
- 2378 Cheshire Place
- 1550 Bancroft Ave Unit 111
- 2334 Benedict Dr
- 1235 Ardmore Dr
- 1218 Ardmore Dr
- 1220 Daily Dr
- 1254 Daily Dr
- 1261 Ardmore Dr
- 1234 Ardmore Dr
- 1276 Daily Dr
- 2240 Benedict Dr
- 1260 Ardmore Dr
- 1289 Ardmore Dr
- 1308 Daily Dr
- 1284 Ardmore Dr
- 1221 Montrose Dr
- 1217 Daily Dr
- 1233 Montrose Dr
- 1275 Montrose Dr
- 1343 Ardmore Dr
- 1253 Daily Dr
- 1326 Ardmore Dr