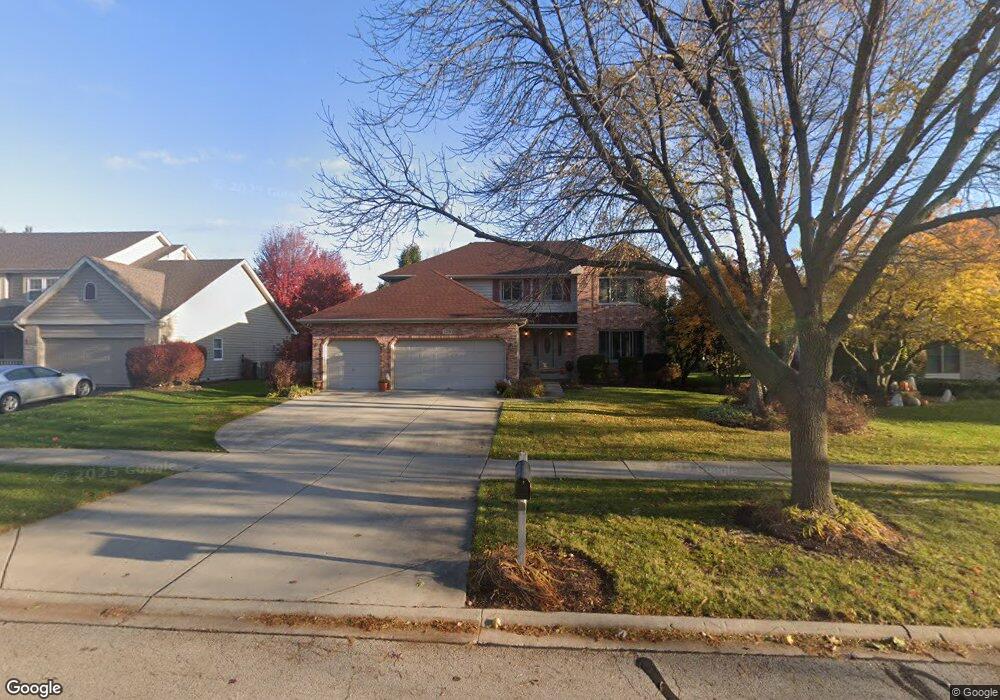
1219 Conan Doyle Rd Naperville, IL 60564
Ashbury NeighborhoodEstimated Value: $659,520 - $798,000
Studio
--
Bath
2,702
Sq Ft
$268/Sq Ft
Est. Value
About This Home
This home is located at 1219 Conan Doyle Rd, Naperville, IL 60564 and is currently estimated at $722,880, approximately $267 per square foot. 1219 Conan Doyle Rd is a home located in Will County with nearby schools including Patterson Elementary School, Gordon Gregory Middle School, and Neuqua Valley High School.
Ownership History
Date
Name
Owned For
Owner Type
Purchase Details
Closed on
Feb 26, 1999
Sold by
Classen Michael G and Classen Laura A
Bought by
Rao Satyanarayana and Rao Nagamani S
Current Estimated Value
Home Financials for this Owner
Home Financials are based on the most recent Mortgage that was taken out on this home.
Original Mortgage
$257,200
Interest Rate
6.94%
Purchase Details
Closed on
Jun 3, 1996
Sold by
Martinez Gerald D and Martinez Joan L
Bought by
Classen Michael G and Classen Laura A
Home Financials for this Owner
Home Financials are based on the most recent Mortgage that was taken out on this home.
Original Mortgage
$207,000
Interest Rate
8.29%
Mortgage Type
Balloon
Create a Home Valuation Report for This Property
The Home Valuation Report is an in-depth analysis detailing your home's value as well as a comparison with similar homes in the area
Home Values in the Area
Average Home Value in this Area
Purchase History
| Date | Buyer | Sale Price | Title Company |
|---|---|---|---|
| Rao Satyanarayana | $321,500 | -- | |
| Classen Michael G | $267,500 | -- |
Source: Public Records
Mortgage History
| Date | Status | Borrower | Loan Amount |
|---|---|---|---|
| Previous Owner | Rao Satyanarayana | $257,200 | |
| Previous Owner | Classen Michael G | $207,000 |
Source: Public Records
Tax History
| Year | Tax Paid | Tax Assessment Tax Assessment Total Assessment is a certain percentage of the fair market value that is determined by local assessors to be the total taxable value of land and additions on the property. | Land | Improvement |
|---|---|---|---|---|
| 2024 | $12,523 | $199,188 | $65,131 | $134,057 |
| 2023 | $12,523 | $175,961 | $57,536 | $118,425 |
| 2022 | $11,572 | $165,722 | $54,428 | $111,294 |
| 2021 | $11,059 | $157,830 | $51,836 | $105,994 |
| 2020 | $10,849 | $155,330 | $51,015 | $104,315 |
| 2019 | $10,662 | $150,952 | $49,577 | $101,375 |
| 2018 | $10,729 | $149,225 | $48,487 | $100,738 |
| 2017 | $10,564 | $145,372 | $47,235 | $98,137 |
| 2016 | $10,544 | $142,242 | $46,218 | $96,024 |
| 2015 | $10,567 | $136,771 | $44,440 | $92,331 |
| 2014 | $10,567 | $132,361 | $44,440 | $87,921 |
| 2013 | $10,567 | $132,361 | $44,440 | $87,921 |
Source: Public Records
Map
Nearby Homes
- 3412 Falkner Dr
- 1244 Hollingswood Ave
- 1007 Hollingswood Ct
- 3111 Landore Dr
- 1126 Starlite Ct
- 3027 Brossman St
- 3718 Tramore Ct
- 3339 Timber Creek Ln Unit 3
- 820 Spring Creek Cir
- 3740 Caine Dr
- 3804 Relstar Ct
- 2627 Homestead Dr
- 3819 Capri Ct
- 719 Eagle Brook Ln Unit 4
- 3520 Timber Creek Ln
- 1137 Crimson Ct
- 2715 Wendy Dr
- 2711 Wendy Dr
- 28W555 Leverenz Rd
- 28W587 Leverenz Rd
- 1215 Conan Doyle Rd
- 1223 Conan Doyle Rd
- 3211 Austin Ct
- 1227 Conan Doyle Rd
- 3207 Austin Ct
- 1220 Conan Doyle Rd
- 1224 Conan Doyle Rd
- 3303 Spenser Ct
- 1207 Conan Doyle Rd
- 1231 Conan Doyle Rd
- 3308 Falkner Dr
- 3208 Austin Ct
- 1304 Bards Ave
- 1308 Bards Ave
- 3307 Spenser Ct
- 1208 Conan Doyle Rd
- 1235 Boswell Ln
- 1227 Boswell Ln
- 1231 Boswell Ln
Your Personal Tour Guide
Ask me questions while you tour the home.