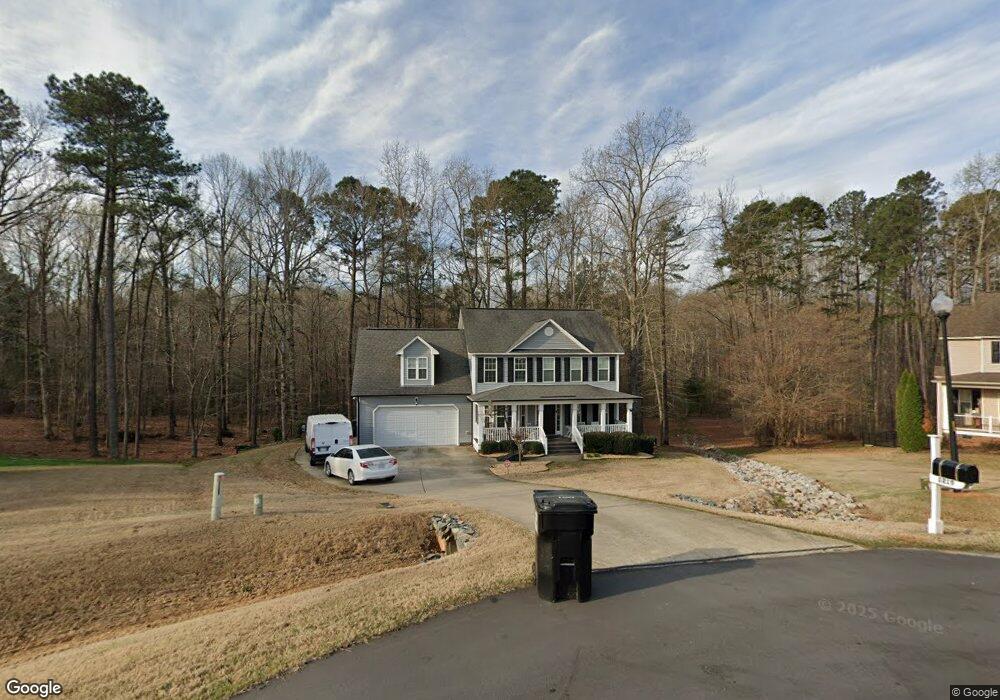
1219 Contender Dr Clayton, NC 27520
Estimated Value: $424,000 - $448,000
3
Beds
3
Baths
2,367
Sq Ft
$184/Sq Ft
Est. Value
About This Home
This home is located at 1219 Contender Dr, Clayton, NC 27520 and is currently estimated at $434,819, approximately $183 per square foot. 1219 Contender Dr is a home located in Johnston County with nearby schools including Polenta Elementary School, Swift Creek Middle, and Cleveland High School.
Ownership History
Date
Name
Owned For
Owner Type
Purchase Details
Closed on
Oct 14, 2011
Sold by
Thompson Cory R and Thompson Cristina
Bought by
Thompson Corey R and Thompson Cristina
Current Estimated Value
Purchase Details
Closed on
Jun 18, 2009
Sold by
Golden Properties & Development Inc
Bought by
Thompson Cory R and Thompson Cristina
Home Financials for this Owner
Home Financials are based on the most recent Mortgage that was taken out on this home.
Original Mortgage
$221,991
Outstanding Balance
$141,087
Interest Rate
4.88%
Mortgage Type
VA
Estimated Equity
$293,732
Purchase Details
Closed on
Mar 9, 2009
Sold by
Son Lan Development Co Inc
Bought by
Golden Properties & Development Inc
Purchase Details
Closed on
Apr 23, 2008
Sold by
Son Lan Ldl Llc
Bought by
Son Lan Development Co Inc
Create a Home Valuation Report for This Property
The Home Valuation Report is an in-depth analysis detailing your home's value as well as a comparison with similar homes in the area
Home Values in the Area
Average Home Value in this Area
Purchase History
| Date | Buyer | Sale Price | Title Company |
|---|---|---|---|
| Thompson Corey R | -- | Genuine Title Llc | |
| Thompson Cory R | $215,000 | None Available | |
| Golden Properties & Development Inc | $245,000 | None Available | |
| Son Lan Development Co Inc | -- | None Available |
Source: Public Records
Mortgage History
| Date | Status | Borrower | Loan Amount |
|---|---|---|---|
| Open | Thompson Cory R | $221,991 |
Source: Public Records
Tax History Compared to Growth
Tax History
| Year | Tax Paid | Tax Assessment Tax Assessment Total Assessment is a certain percentage of the fair market value that is determined by local assessors to be the total taxable value of land and additions on the property. | Land | Improvement |
|---|---|---|---|---|
| 2025 | $2,472 | $389,320 | $80,000 | $309,320 |
| 2024 | $1,952 | $240,990 | $42,000 | $198,990 |
| 2023 | $1,856 | $240,990 | $42,000 | $198,990 |
| 2022 | $1,904 | $240,990 | $42,000 | $198,990 |
| 2021 | $1,904 | $240,990 | $42,000 | $198,990 |
| 2020 | $1,976 | $240,990 | $42,000 | $198,990 |
| 2019 | $1,976 | $240,990 | $42,000 | $198,990 |
| 2018 | $1,811 | $215,640 | $33,000 | $182,640 |
| 2017 | $1,811 | $215,640 | $33,000 | $182,640 |
| 2016 | $1,811 | $215,640 | $33,000 | $182,640 |
| 2015 | $1,811 | $215,640 | $33,000 | $182,640 |
| 2014 | $1,811 | $215,640 | $33,000 | $182,640 |
Source: Public Records
Map
Nearby Homes
- 109 Fountain Dr
- 346 Silver Creek Dr
- 391 Crystal Creek Dr
- 433 Steel Bridge Rd
- 386 Rising Star Dr
- 328 Avery Meadows Dr
- 52 Quail Point Cir
- 79 Quail Point Cir
- 20 Ava Ln
- Wescott Plan at High Springs
- Raleigh Plan at High Springs
- Asheboro Plan at High Springs
- Davidson Plan at High Springs
- Cooper Plan at High Springs
- McDowell Plan at High Springs
- Cypress Plan at High Springs
- Colfax Plan at High Springs
- 62 Fire Brand Dr
- 2005 Mooregate Ct
- 60 Branding Iron Dr
- 1215 Contender Dr
- 1220 Contender Dr
- 1212 Contender Dr
- 1205 Contender Dr
- 1202 Contender Dr Unit HAMPT
- 1202 Contender Dr
- 1191 Contender Dr
- 1191 Contender Dr Unit Carlo
- 1188 Contender Dr
- 1179 Contender Dr
- 1176 Contender Dr
- 1167 Contender Dr
- 1162 Contender Dr
- 1153 Contender Dr
- 1150 Contender Dr
- 107 Regulator Dr
- 108 Regulator Dr
- 1138 Contender Dr
- 104 Regulator Dr
- 103 Regulator Dr