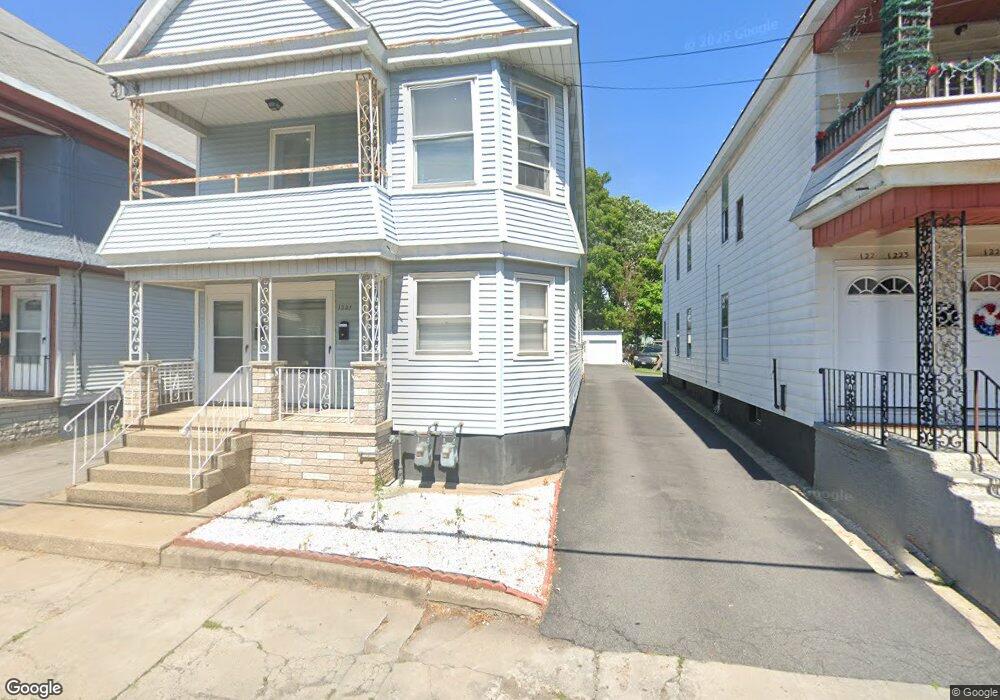
1219 Crane St Schenectady, NY 12303
Mont Pleasant NeighborhoodEstimated Value: $208,000 - $232,000
6
Beds
2
Baths
2,260
Sq Ft
$99/Sq Ft
Est. Value
About This Home
This home is located at 1219 Crane St, Schenectady, NY 12303 and is currently estimated at $224,353, approximately $99 per square foot. 1219 Crane St is a home located in Schenectady County with nearby schools including William C Keane Elementary School, Central Park Middle School, and Schenectady High School.
Ownership History
Date
Name
Owned For
Owner Type
Purchase Details
Closed on
Oct 19, 2005
Sold by
Tetlak Joseph J
Bought by
Birju Vinda
Current Estimated Value
Home Financials for this Owner
Home Financials are based on the most recent Mortgage that was taken out on this home.
Original Mortgage
$85,000
Outstanding Balance
$55,251
Interest Rate
9.85%
Mortgage Type
Adjustable Rate Mortgage/ARM
Estimated Equity
$169,102
Purchase Details
Closed on
Jun 10, 1993
Sold by
Sarchioto J P
Bought by
Tetlak Joseph J
Create a Home Valuation Report for This Property
The Home Valuation Report is an in-depth analysis detailing your home's value as well as a comparison with similar homes in the area
Home Values in the Area
Average Home Value in this Area
Purchase History
| Date | Buyer | Sale Price | Title Company |
|---|---|---|---|
| Birju Vinda | $110,000 | Stanley J Skubis | |
| Tetlak Joseph J | $89,000 | -- |
Source: Public Records
Mortgage History
| Date | Status | Borrower | Loan Amount |
|---|---|---|---|
| Open | Birju Vinda | $85,000 |
Source: Public Records
Tax History
| Year | Tax Paid | Tax Assessment Tax Assessment Total Assessment is a certain percentage of the fair market value that is determined by local assessors to be the total taxable value of land and additions on the property. | Land | Improvement |
|---|---|---|---|---|
| 2024 | $6,346 | $111,900 | $16,800 | $95,100 |
| 2023 | $62 | $111,900 | $16,800 | $95,100 |
| 2022 | $6,030 | $111,900 | $16,800 | $95,100 |
| 2021 | $5,987 | $111,900 | $16,800 | $95,100 |
| 2020 | $5,883 | $111,900 | $16,800 | $95,100 |
| 2019 | $3,565 | $111,900 | $16,800 | $95,100 |
| 2018 | $5,218 | $111,900 | $16,800 | $95,100 |
| 2017 | $4,616 | $111,900 | $16,800 | $95,100 |
| 2016 | $5,394 | $111,900 | $16,800 | $95,100 |
| 2015 | -- | $111,900 | $16,800 | $95,100 |
| 2014 | -- | $111,900 | $16,800 | $95,100 |
Source: Public Records
Map
Nearby Homes
- 1114 9th Ave
- 1338 Crane St
- 1020 Pearl St
- 1356 Wing Ave
- 1331 Hodgson St
- 1017 Chrisler Ave
- 1337 8th Ave
- 1084 Webster St
- 1130 Forest Rd
- 1374 10th Ave
- 1341 7th Ave
- 817 Holland Rd
- 1325 6th Ave
- 1133 Cutler St
- 1321 Richard St
- 1067 Cutler St
- 1087 Davis Terrace
- 1320 4th Ave
- L2.1 Torrington Ave
- 1646 van Cortland St
Your Personal Tour Guide
Ask me questions while you tour the home.