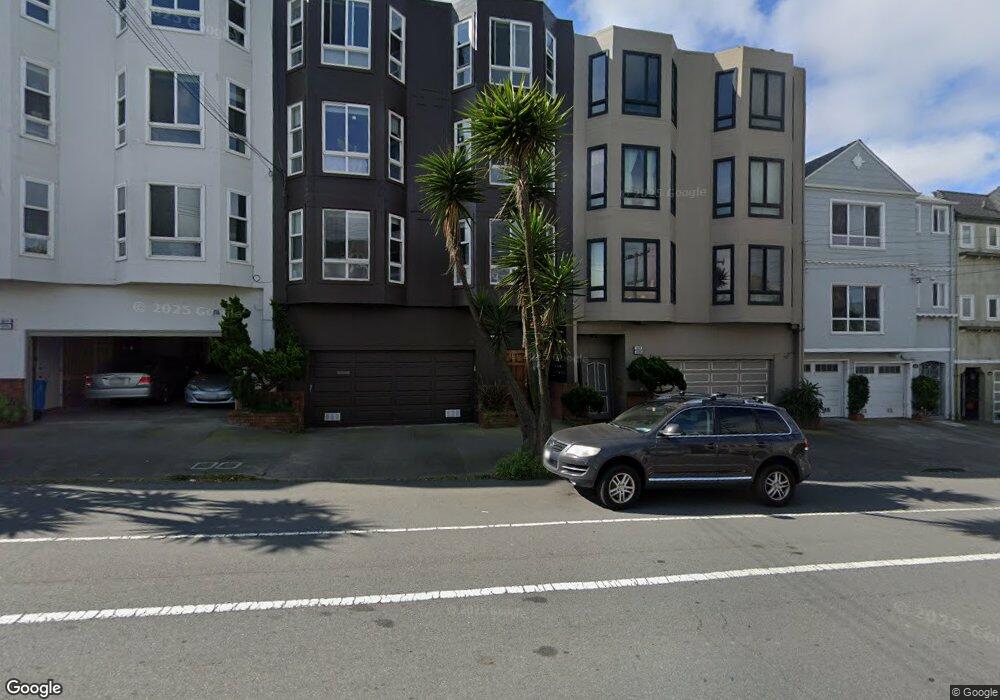
1219 Kirkham St Unit 1221 San Francisco, CA 94122
Inner Sunset NeighborhoodEstimated Value: $2,054,000 - $2,466,357
6
Beds
6
Baths
3,279
Sq Ft
$681/Sq Ft
Est. Value
About This Home
This home is located at 1219 Kirkham St Unit 1221, San Francisco, CA 94122 and is currently estimated at $2,233,839, approximately $681 per square foot. 1219 Kirkham St Unit 1221 is a home located in San Francisco County with nearby schools including Jefferson Elementary School, Giannini (A.P.) Middle School, and Cornerstone Academy-Lawton Campus.
Ownership History
Date
Name
Owned For
Owner Type
Purchase Details
Closed on
Oct 9, 2007
Sold by
Quach Nam and Chen Charlene
Bought by
Chen Charlene and Quach Nam
Current Estimated Value
Purchase Details
Closed on
Mar 22, 2007
Sold by
Lee Richard Kong Nien
Bought by
Chen Charlene and Quach Nam
Home Financials for this Owner
Home Financials are based on the most recent Mortgage that was taken out on this home.
Original Mortgage
$833,000
Outstanding Balance
$502,545
Interest Rate
6.2%
Mortgage Type
Commercial
Estimated Equity
$1,731,294
Purchase Details
Closed on
Aug 16, 1996
Sold by
Profita Holding N V
Bought by
Lee Richard Kong Nien
Home Financials for this Owner
Home Financials are based on the most recent Mortgage that was taken out on this home.
Original Mortgage
$131,600
Interest Rate
4.95%
Mortgage Type
Commercial
Purchase Details
Closed on
Nov 14, 1995
Sold by
Saenz Enrique
Bought by
Saenz Elena
Create a Home Valuation Report for This Property
The Home Valuation Report is an in-depth analysis detailing your home's value as well as a comparison with similar homes in the area
Home Values in the Area
Average Home Value in this Area
Purchase History
| Date | Buyer | Sale Price | Title Company |
|---|---|---|---|
| Chen Charlene | -- | None Available | |
| Chen Charlene | $1,284,000 | Chicago Title Co | |
| Lee Richard Kong Nien | $437,500 | Fidelity National Title Co | |
| Saenz Elena | -- | -- |
Source: Public Records
Mortgage History
| Date | Status | Borrower | Loan Amount |
|---|---|---|---|
| Open | Chen Charlene | $833,000 | |
| Previous Owner | Lee Richard Kong Nien | $131,600 |
Source: Public Records
Tax History Compared to Growth
Tax History
| Year | Tax Paid | Tax Assessment Tax Assessment Total Assessment is a certain percentage of the fair market value that is determined by local assessors to be the total taxable value of land and additions on the property. | Land | Improvement |
|---|---|---|---|---|
| 2025 | $21,590 | $1,792,512 | $1,032,168 | $760,344 |
| 2024 | $21,590 | $1,757,366 | $1,011,930 | $745,436 |
| 2023 | $21,177 | $1,722,910 | $992,089 | $730,821 |
| 2022 | $20,764 | $1,689,129 | $972,637 | $716,492 |
| 2021 | $20,400 | $1,656,010 | $953,566 | $702,444 |
| 2020 | $20,587 | $1,639,031 | $943,789 | $695,242 |
| 2019 | $19,887 | $1,606,894 | $925,284 | $681,610 |
| 2018 | $19,214 | $1,575,388 | $907,142 | $668,246 |
| 2017 | $18,692 | $1,544,499 | $889,355 | $655,144 |
| 2016 | $18,392 | $1,514,216 | $871,917 | $642,299 |
| 2015 | $18,161 | $1,491,472 | $858,820 | $632,652 |
| 2014 | $17,686 | $1,462,257 | $841,997 | $620,260 |
Source: Public Records
Map
Nearby Homes
- 1483 19th Ave
- 1346 Judah St
- 1349 17th Ave
- 1392 Funston Ave
- 1688 20th Ave Unit 1688
- 1515 11th Ave
- 1701 Funston Ave Unit 1703
- 1616 Judah St
- 1255-1257 19th Ave
- 1635 10th Ave Unit 5
- 1815 18th Ave
- 1228 Funston Ave
- 1822 19th Ave Unit 1
- 1822 19th Ave
- 1822 19th Ave Unit 2
- 1831 14th Ave
- 50 Cascade Walk
- 1883-1885 16th Ave
- 1678 24th Ave
- 1360 9th Ave Unit 7
- 1215 Kirkham St
- 1213 Kirkham St Unit 1
- 1225 Kirkham St
- 1235 Kirkham St
- 1207 Kirkham St Unit 1209
- 1241 Kirkham St
- 1203 Kirkham St
- 1201 Kirkham St Unit 1
- 1531 16th Ave
- 1515 16th Ave
- 1518 17th Ave
- 1510 17th Ave
- 1506 17th Ave
- 1255 Kirkham St
- 1514 17th Ave
- 1537 16th Ave
- 1522 17th Ave
- 1216 Kirkham St Unit 1218
- 1210 Kirkham St Unit 1212
- 1526 17th Ave