1219 Lost Lock Way New Haven, IN 46774
Estimated Value: $217,859 - $255,000
3
Beds
2
Baths
1,270
Sq Ft
$182/Sq Ft
Est. Value
About This Home
This home is located at 1219 Lost Lock Way, New Haven, IN 46774 and is currently estimated at $231,715, approximately $182 per square foot. 1219 Lost Lock Way is a home located in Allen County with nearby schools including New Haven Primary School, New Haven Intermediate School, and New Haven High School.
Ownership History
Date
Name
Owned For
Owner Type
Purchase Details
Closed on
Mar 21, 2005
Sold by
Werling Andrew D and Werling Lea Ann
Bought by
Ritz Robert G
Current Estimated Value
Home Financials for this Owner
Home Financials are based on the most recent Mortgage that was taken out on this home.
Original Mortgage
$85,600
Outstanding Balance
$43,397
Interest Rate
5.61%
Mortgage Type
Purchase Money Mortgage
Estimated Equity
$188,318
Purchase Details
Closed on
Feb 11, 2002
Sold by
Cendant Mobility Financial Corp
Bought by
Werling Andrew D and Baumgardner Lea Ann
Home Financials for this Owner
Home Financials are based on the most recent Mortgage that was taken out on this home.
Original Mortgage
$98,353
Interest Rate
6.92%
Mortgage Type
FHA
Purchase Details
Closed on
Oct 4, 2001
Sold by
Hiatt Bradly E and Caesar Traci S
Bought by
Cendant Mobility Financial Corp
Purchase Details
Closed on
Aug 21, 2001
Sold by
Caesar Traci S
Bought by
Caesar Traci S and Hiatt Bradly E
Create a Home Valuation Report for This Property
The Home Valuation Report is an in-depth analysis detailing your home's value as well as a comparison with similar homes in the area
Home Values in the Area
Average Home Value in this Area
Purchase History
| Date | Buyer | Sale Price | Title Company |
|---|---|---|---|
| Ritz Robert G | -- | Century Title Services | |
| Werling Andrew D | -- | Three Rivers Title Company I | |
| Cendant Mobility Financial Corp | -- | -- | |
| Caesar Traci S | -- | -- |
Source: Public Records
Mortgage History
| Date | Status | Borrower | Loan Amount |
|---|---|---|---|
| Open | Ritz Robert G | $85,600 | |
| Previous Owner | Werling Andrew D | $98,353 |
Source: Public Records
Tax History Compared to Growth
Tax History
| Year | Tax Paid | Tax Assessment Tax Assessment Total Assessment is a certain percentage of the fair market value that is determined by local assessors to be the total taxable value of land and additions on the property. | Land | Improvement |
|---|---|---|---|---|
| 2024 | $1,760 | $191,200 | $38,600 | $152,600 |
| 2022 | $1,491 | $149,100 | $26,700 | $122,400 |
| 2021 | $1,294 | $129,400 | $26,700 | $102,700 |
| 2020 | $1,224 | $126,800 | $26,700 | $100,100 |
| 2019 | $1,241 | $124,400 | $26,700 | $97,700 |
| 2018 | $1,196 | $119,600 | $26,700 | $92,900 |
| 2017 | $1,033 | $106,700 | $26,700 | $80,000 |
| 2016 | $969 | $103,700 | $26,700 | $77,000 |
| 2014 | $1,015 | $108,600 | $26,700 | $81,900 |
| 2013 | $1,104 | $113,100 | $26,700 | $86,400 |
Source: Public Records
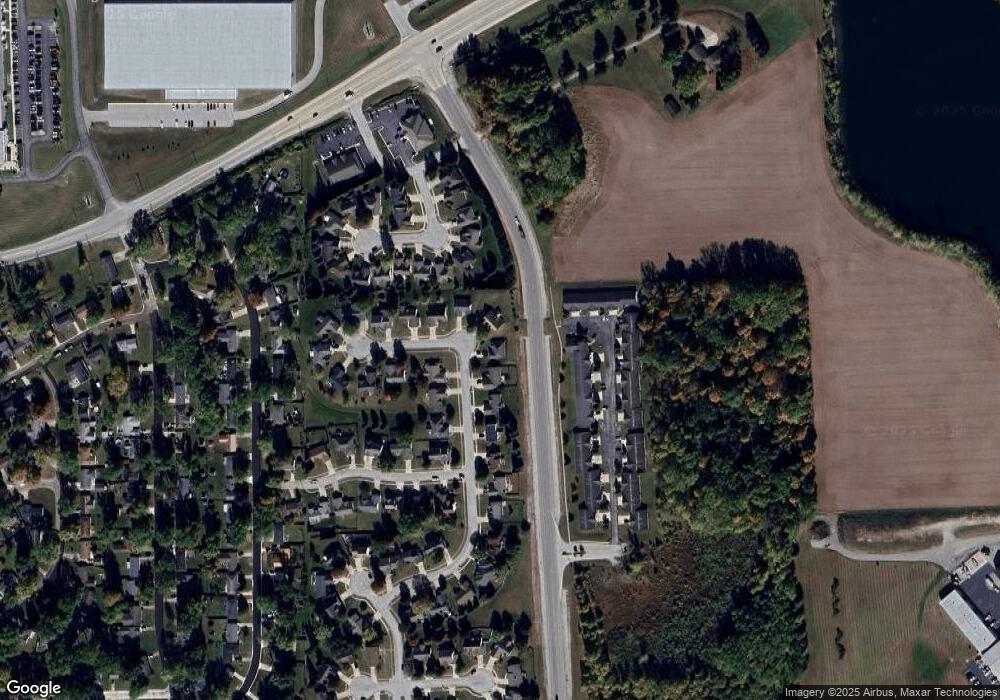
Map
Nearby Homes
- 1231 Lost Lock Way
- 241 Tweedwood Dr
- 347 Twillo Run Dr
- 1415 Summit St
- 738 Keller Dr
- 1135 Summit St
- 1004 Keller Dr
- 1511 State Road 930 E Rd
- 627 Main St
- 1710 Richfield Dr
- 1506 Tartan Ct
- 1717 E Macgregor Dr
- 9336 Hobart Way
- 2427 Valley Creek Run
- 9312 Hobart Way
- 9300 Hobart Way
- 694 Chellberge Pass
- 702 Chellberge Pass
- 714 Chellberge Pass
- 2512 Valley Creek Run
- 1223 Lost Lock Way
- 1215 Lost Lock Way
- 1300 Linden Rd
- 10925 Keelboat Cove
- 1227 Lost Lock Way
- 11231 Rose Ave
- 1220 Lost Lock Way
- 10901 Keelboat Cove
- 1224 Lost Lock Way
- 10883 Boulder Cove
- 10887 Keelboat Cove
- 1228 Lost Lock Way
- 10874 Keelboat Cove
- 1235 Lost Lock Way
- 10867 Boulder Cove
- 1140 Boulder Ridge Dr
- 10929 Trailwood Ln
- 10863 Keelboat Cove
- 10851 Boulder Cove
- 10850 Keelboat Cove