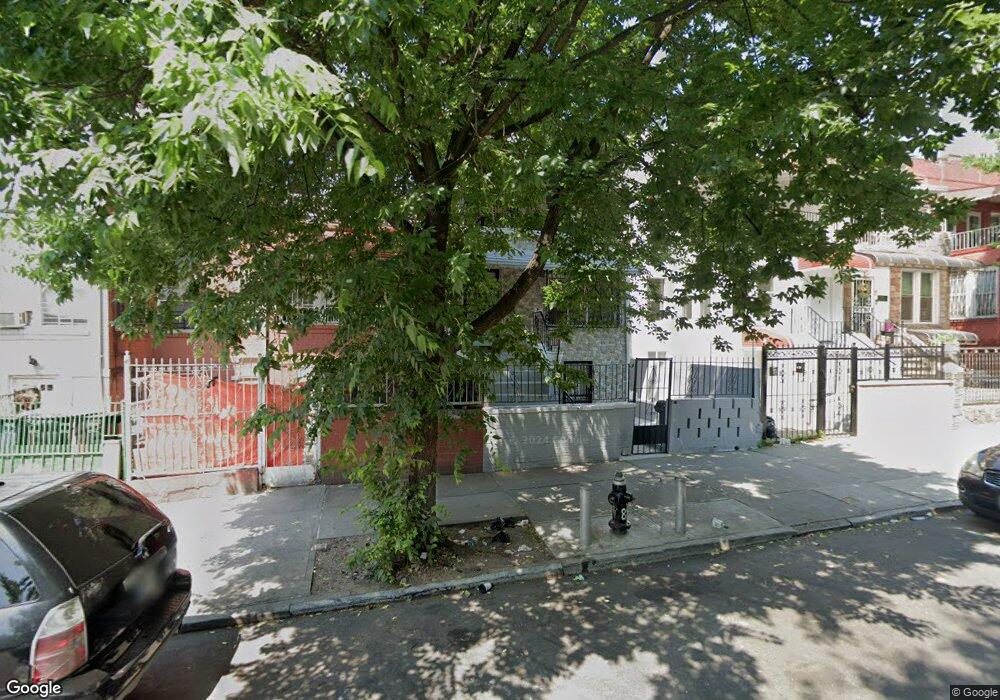
1219 Manor Ave Bronx, NY 10472
Parkchester NeighborhoodEstimated Value: $584,074 - $933,000
Studio
--
Bath
1,400
Sq Ft
$562/Sq Ft
Est. Value
About This Home
This home is located at 1219 Manor Ave, Bronx, NY 10472 and is currently estimated at $786,769, approximately $561 per square foot. 1219 Manor Ave is a home located in Bronx County with nearby schools including P.S. 195, P.S. 196, and P.S. 214.
Ownership History
Date
Name
Owned For
Owner Type
Purchase Details
Closed on
Dec 5, 2020
Sold by
Torres Carlos A
Bought by
Torres Carlos A
Current Estimated Value
Purchase Details
Closed on
Jul 14, 2020
Sold by
Torres Carlos A
Bought by
Torres Carlos A
Purchase Details
Closed on
Feb 17, 2016
Sold by
Rodriguez Heraclia P
Bought by
Rodriguez Heraclia P and Torres Carlos A
Purchase Details
Closed on
Jun 15, 2012
Sold by
Rodriguez Heraclia P and Torres Carlos A
Bought by
Rodriguez Heraclia P
Purchase Details
Closed on
May 12, 2008
Sold by
Rodriguez Heraclia and Rodriguez Heraclia P
Bought by
Rodriguez Heraclia P and Torres Jr Carlos A
Home Financials for this Owner
Home Financials are based on the most recent Mortgage that was taken out on this home.
Original Mortgage
$130,564
Interest Rate
5.91%
Mortgage Type
Purchase Money Mortgage
Purchase Details
Closed on
May 30, 2001
Sold by
Rodriguez Heraclia
Bought by
Rodriguez Heraclia
Create a Home Valuation Report for This Property
The Home Valuation Report is an in-depth analysis detailing your home's value as well as a comparison with similar homes in the area
Home Values in the Area
Average Home Value in this Area
Purchase History
| Date | Buyer | Sale Price | Title Company |
|---|---|---|---|
| Torres Carlos A | -- | -- | |
| Torres Carlos A | -- | -- | |
| Rodriguez Heraclia P | -- | -- | |
| Rodriguez Heraclia P | -- | -- | |
| Rodriguez Heraclia P | -- | -- | |
| Rodriguez Heraclia | -- | -- |
Source: Public Records
Mortgage History
| Date | Status | Borrower | Loan Amount |
|---|---|---|---|
| Previous Owner | Rodriguez Heraclia P | $130,564 |
Source: Public Records
Tax History
| Year | Tax Paid | Tax Assessment Tax Assessment Total Assessment is a certain percentage of the fair market value that is determined by local assessors to be the total taxable value of land and additions on the property. | Land | Improvement |
|---|---|---|---|---|
| 2025 | $5,003 | $26,404 | $5,777 | $20,627 |
| 2024 | $5,003 | $24,910 | $5,605 | $19,305 |
| 2023 | $4,773 | $23,501 | $6,113 | $17,388 |
| 2022 | $4,616 | $33,900 | $8,100 | $25,800 |
| 2021 | $4,605 | $27,540 | $8,100 | $19,440 |
| 2020 | $4,361 | $30,420 | $8,100 | $22,320 |
| 2019 | $4,050 | $29,940 | $8,100 | $21,840 |
| 2018 | $3,695 | $19,584 | $5,309 | $14,275 |
| 2017 | $3,693 | $19,584 | $6,078 | $13,506 |
| 2016 | $3,576 | $19,436 | $7,717 | $11,719 |
| 2015 | $688 | $18,336 | $8,676 | $9,660 |
| 2014 | $688 | $17,299 | $8,238 | $9,061 |
Source: Public Records
Map
Nearby Homes
- 1235 Ward Ave
- 1244 Stratford Ave
- 1636 E 172nd St
- 1506 E 172nd St
- 1330 Elder Ave
- 1126 Ward Ave
- 1661 E 172nd St
- 1238 Colgate Ave
- 1147 Wheeler Ave
- 1156 Metcalf Ave
- 1146 Metcalf Ave
- 1071 Stratford Ave
- 1059 Ward Ave
- 1049 Ward Ave
- 1044 Stratford Ave
- 1330 Croes Ave
- 1350 Croes Ave
- 1139 Noble Ave
- 1054 Evergreen Ave
- 1052 Evergreen Ave
Your Personal Tour Guide
Ask me questions while you tour the home.