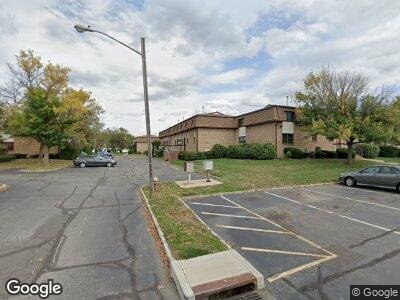
1219 N Oaks Blvd North Brunswick, NJ 08902
Estimated Value: $223,000 - $276,000
1
Bed
1
Bath
942
Sq Ft
$260/Sq Ft
Est. Value
About This Home
This home is located at 1219 N Oaks Blvd, North Brunswick, NJ 08902 and is currently estimated at $245,159, approximately $260 per square foot. 1219 N Oaks Blvd is a home located in Middlesex County with nearby schools including Parsons Elementary School, Livingston Park Elementary School, and Linwood Middle School.
Ownership History
Date
Name
Owned For
Owner Type
Purchase Details
Closed on
Sep 19, 2014
Sold by
Jain Pankaj
Bought by
Jain Pankaj and Jain Dolly
Current Estimated Value
Purchase Details
Closed on
May 15, 2013
Sold by
Grinberg Alexandera
Bought by
Jain Pankaj
Home Financials for this Owner
Home Financials are based on the most recent Mortgage that was taken out on this home.
Original Mortgage
$69,750
Interest Rate
2.7%
Mortgage Type
New Conventional
Purchase Details
Closed on
Dec 6, 2005
Sold by
Albers Stacey
Bought by
Grinberg Alexandra
Home Financials for this Owner
Home Financials are based on the most recent Mortgage that was taken out on this home.
Original Mortgage
$137,600
Interest Rate
6.31%
Purchase Details
Closed on
Nov 30, 1995
Sold by
Bernheimer Joseph
Bought by
Ober Stacey
Home Financials for this Owner
Home Financials are based on the most recent Mortgage that was taken out on this home.
Original Mortgage
$36,000
Interest Rate
7.37%
Create a Home Valuation Report for This Property
The Home Valuation Report is an in-depth analysis detailing your home's value as well as a comparison with similar homes in the area
Home Values in the Area
Average Home Value in this Area
Purchase History
| Date | Buyer | Sale Price | Title Company |
|---|---|---|---|
| Jain Pankaj | -- | None Available | |
| Jain Pankaj | $93,000 | Westcor Land Title Insuran | |
| Grinberg Alexandra | $172,000 | -- | |
| Ober Stacey | $45,500 | -- |
Source: Public Records
Mortgage History
| Date | Status | Borrower | Loan Amount |
|---|---|---|---|
| Open | Jain Pankaj | $119,250 | |
| Closed | Jain Pankaj | $69,750 | |
| Previous Owner | Grinberg Alexandra | $137,600 | |
| Previous Owner | Ober Stacey | $36,000 |
Source: Public Records
Tax History Compared to Growth
Tax History
| Year | Tax Paid | Tax Assessment Tax Assessment Total Assessment is a certain percentage of the fair market value that is determined by local assessors to be the total taxable value of land and additions on the property. | Land | Improvement |
|---|---|---|---|---|
| 2024 | $2,775 | $44,600 | $12,000 | $32,600 |
| 2023 | $2,775 | $44,600 | $12,000 | $32,600 |
| 2022 | $2,680 | $44,600 | $12,000 | $32,600 |
| 2021 | $1,953 | $44,600 | $12,000 | $32,600 |
| 2020 | $2,581 | $44,600 | $12,000 | $32,600 |
| 2019 | $2,528 | $44,600 | $12,000 | $32,600 |
| 2018 | $2,476 | $44,600 | $12,000 | $32,600 |
| 2017 | $2,432 | $44,600 | $12,000 | $32,600 |
| 2016 | $2,382 | $44,600 | $12,000 | $32,600 |
| 2015 | $2,341 | $44,600 | $12,000 | $32,600 |
| 2014 | $2,315 | $44,600 | $12,000 | $32,600 |
Source: Public Records
Map
Nearby Homes
- 405 N Oaks Blvd
- 1313 N Oaks Blvd
- 312 N Oaks Blvd Unit 312
- 1178 Newton St
- 1487 Columbia Dr
- 224 Pennsylvania Way
- 155 Pennsylvania Way Unit B1
- 1209 Dakota Rd
- 1133 Livingston Ave Unit 11C
- 1133 Livingston Ave Unit 14
- 1133 Livingston Ave
- 1210 Cherokee Rd
- 271 Constitution Cir
- 1078 Newton St
- 297 Constitution Cir
- 3908 Birchwood Ct
- 755 Myrtle Rd
- 4 Walnut St
- 4319 Birchwood Ct
- 4002 Birchwood Ct
- 1219 N Oaks Blvd
- 1220 N Oaks Blvd
- 1220 N Oaks Blvd Unit 4
- 1222 N Oaks Blvd Unit 1222
- 1221 N Oaks Blvd
- 1217 N Oaks Blvd
- 1218 N Oaks Blvd
- 1224 N Oaks Blvd
- 1223 N Oaks Blvd
- 1215 N Oaks Blvd
- 1216 N Oaks Blvd
- 1214 N Oaks Blvd
- 1213 N Oaks Blvd
- 1103 N Oaks Blvd
- 1104 N Oaks Blvd
- 1101 N Oaks Blvd
- 1211 N Oaks Blvd
- 1102 N Oaks Blvd
- 1102 N Oaks Blvd Unit 2
- 1212 N Oaks Blvd