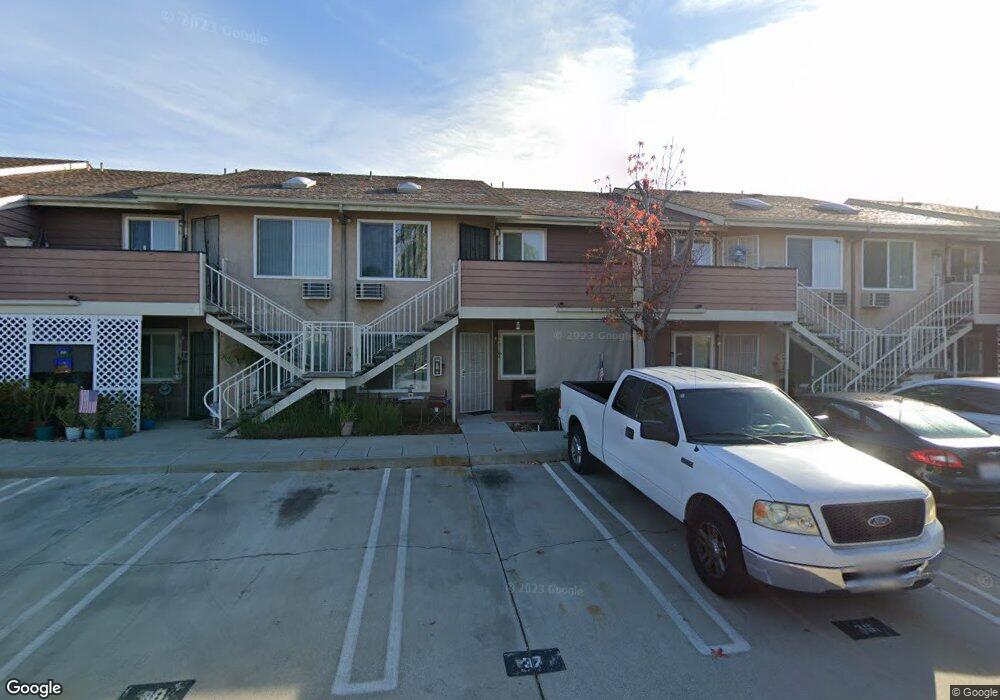
1219 Persimmon Ave El Cajon, CA 92021
Bostonia Neighborhood
1
Bed
--
Bath
525
Sq Ft
38,768
Sq Ft Lot
About This Home
Quiet, well maintained senior housing community on a quiet street. At least one tenant must be Age 55+
Apartment features:
525 sq ft
1 Br, 1 Ba
Fully remodeled unit with fresh paint, quartz counters, new appliances, new flooring.
Air conditioning
Upstairs units available, no downstairs units at this time
$1500 per month plus utilities
Electric only
1 dedicated parking space
Laundry facility
Landscaping included
$35 application fee
Pets ok
Pet deposit $300
Create a Home Valuation Report for This Property
The Home Valuation Report is an in-depth analysis detailing your home's value as well as a comparison with similar homes in the area
Home Values in the Area
Average Home Value in this Area
Property History
| Date | Event | Price | List to Sale | Price per Sq Ft |
|---|---|---|---|---|
| 03/06/2026 03/06/26 | Off Market | $1,500 | -- | -- |
| 12/03/2025 12/03/25 | For Rent | $1,500 | 0.0% | -- |
| 10/25/2025 10/25/25 | Off Market | $1,500 | -- | -- |
| 08/28/2025 08/28/25 | For Rent | $1,500 | 0.0% | -- |
| 06/09/2025 06/09/25 | Off Market | $1,500 | -- | -- |
| 05/21/2025 05/21/25 | For Rent | $1,500 | 0.0% | -- |
| 01/24/2025 01/24/25 | Off Market | $1,500 | -- | -- |
| 01/04/2025 01/04/25 | For Rent | $1,500 | 0.0% | -- |
| 11/18/2024 11/18/24 | Off Market | $1,500 | -- | -- |
| 10/02/2024 10/02/24 | Price Changed | $1,500 | 0.0% | $3 / Sq Ft |
| 10/02/2024 10/02/24 | For Rent | $1,500 | 0.0% | -- |
| 08/23/2024 08/23/24 | For Rent | $1,500 | -- | -- |
Tax History
| Year | Tax Paid | Tax Assessment Tax Assessment Total Assessment is a certain percentage of the fair market value that is determined by local assessors to be the total taxable value of land and additions on the property. | Land | Improvement |
|---|---|---|---|---|
| 2025 | $137,824 | $7,391,750 | $2,868,445 | $4,523,305 |
| 2024 | $137,824 | $7,246,814 | $2,812,201 | $4,434,613 |
| 2023 | $132,425 | $7,074,720 | $2,757,060 | $4,317,660 |
| 2022 | $128,337 | $6,936,000 | $2,703,000 | $4,233,000 |
| 2021 | $119,103 | $6,650,000 | $2,650,000 | $4,000,000 |
| 2020 | $67,030 | $2,459,409 | $1,102,255 | $1,357,154 |
| 2019 | $65,988 | $2,411,187 | $1,080,643 | $1,330,544 |
| 2018 | $63,866 | $2,363,909 | $1,059,454 | $1,304,455 |
| 2017 | $61,653 | $2,317,559 | $1,038,681 | $1,278,878 |
| 2016 | $59,189 | $2,272,117 | $1,018,315 | $1,253,802 |
| 2015 | $58,632 | $2,237,988 | $1,003,019 | $1,234,969 |
| 2014 | $57,301 | $2,194,150 | $983,372 | $1,210,778 |
Source: Public Records
Map
Nearby Homes
- 1122-24 Oro St
- 1145 Sumner Ave
- 1263 Jeannine Ln
- 1255 Jeannine Ln
- 917 N 1st St
- 1128 Dawnridge Ave
- 1161 N Anza St
- 1263 Cresthill Rd
- 1045 Peach Ave Unit 61
- 1372 Marline Ave
- 1675 N 2nd St
- 1166 Evelyn Dr
- 1000 Teatro Cir
- 915 Stoneys Ln
- 1315 Pepper Dr Unit 67
- 514 Shady Ln Unit C
- 540 Oakdale Ln Unit C
- 1244 E Madison Ave Unit C
- 930 Peach Ave Unit 19
- 1277 N Mollison Ave Unit F
- 1155 Persimmon Ct Unit 57
- 1225 Persimmon Ave Unit 27
- 1145 Persimmon Ct Unit 47
- 1135 Persimmon Ct Unit 37
- 1201 Persimmon Ave
- 1232 Persimmon Ave
- 1231 Persimmon Ave
- 1221 Oro St
- 1234 Persimmon Ave Unit 36
- 1216 Sumner Ave Unit 18
- 1212 Sumner Ave Unit 14
- 1127 Oro St
- 1230 Persimmon Ave
- 1195 Persimmon Ave
- 1148 Oro St
- 1142 Oro St Unit 44
- 1154 Crosby St
- 1146 Crosby St
- 1158 Crosby St
- 1242 Persimmon Ave
Your Personal Tour Guide
Ask me questions while you tour the home.