NOT LISTED FOR SALE

1219 Riverside Ave Streator, IL 61364

Estimated Value: $126,000 - $142,000

3 Beds
2 Baths
1,215 Sq Ft
$111/Sq Ft Est. Value

Last Sold February 03, 2017

Last sale price $66,000 $54 Per Sq Ft

Est. 104% increase in value since last sale

Current estimated payment $993/month

About This Home

As of February 2017

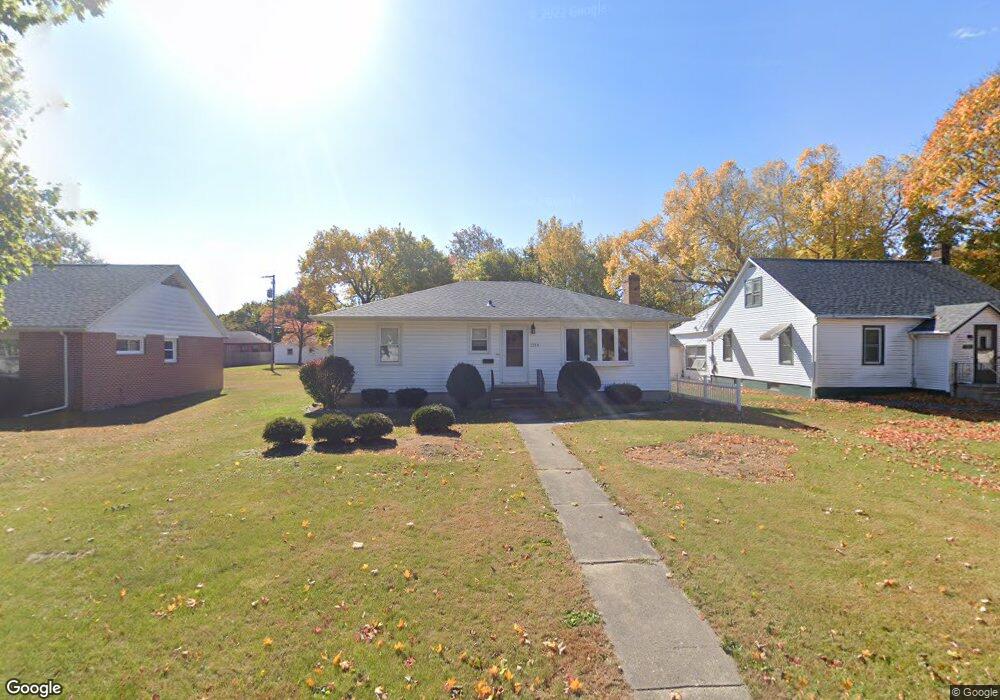
Well built one owner family home with many nice features. Beautiful hardwood floors throughout the bedrooms. Deep walk in closets in each bedroom. Nice basement with poured concrete walls and extra kitchen and bath. Perfect to finish into a large family room. 3 bedrooms, 2 baths, newer replacement windows throughout.

Ownership History

Date Name Owned For Owner Type

Purchase Details

Listed on
Dec 15, 2016
Closed on
Feb 3, 2017
Sold by
Campbell Mary and Sickley Della Mae
Bought by
Renner Nicole
Seller's Agent
Beckie Chismarick
Chismarick Realty, LLC
Buyer's Agent
Jennifer Gura
Chismarick Realty, LLC
List Price
$69,900
Sold Price
$66,000
Premium/Discount to List
-$3,900
-5.58%
Current Estimated Value
$134,905

Home Financials for this Owner

Home Financials are based on the most recent Mortgage that was taken out on this home.
Estimated Appreciation
$68,905
Avg. Annual Appreciation
8.54%
Original Mortgage
$66,667
Outstanding Balance
$55,473
Interest Rate
4.38%
Mortgage Type
New Conventional
Estimated Equity
$79,432
Source: Public Records

Range of Values:

Collateral Analytics

Collateral Analytics Collateral Analytics AVMs (Automated Valuation Model) employ a number of statistical approaches combined with neighborhood-specific comparable selection guarantees the most up-to-date and precise valuations.

Not Available

Collateral Analytics does not have data for the current month. Please view the chart for historical values.

ICE

ICE Mortgage Technology ICE Mortgage Technology’s AVM (Automated Valuation Model) is a state-of-the-art online residential property valuation tool that provides a quick and accurate estimate of the value of almost any home in the U.S.

Not Available

ICE Mortgage Technology does not have data for the current month. Please view the chart for historical values.

First American

First American First American Data & Analytics’ next-generation AVM combines unrivaled data assets with a blended ensemble of valuation models to produce highly accurate, reliable valuations you can trust.

Not Available

First American does not have data for the current month. Please view the chart for historical values.

Quantarium

Quantarium Quantarium’s valuation service, repeatedly proven the industry’s most accurate and comprehensive, is supercharged with a self-learning and auto-tuning AI engine that continually becomes smarter and more accurate as it processes daily inputs from the industry’s leading RE data lake.

Not Available

Quantarium does not have data for the current month. Please view the chart for historical values.

Average Value
Not Available
List Price
Sold Price
Create a Home Valuation Report for This Property
The Home Valuation Report is an in-depth analysis detailing your home's value as well as a comparison with similar homes in the area

Home Values in the Area

Source: Public Records

Average Home Value in this Area


Source: Public Records

Purchase History

Date Buyer Sale Price Title Company
Renner Nicole $66,000 --
Source: Public Records

Mortgage History

Date Status Borrower Loan Amount
Open Renner Nicole $66,667
Source: Public Records

Property History

Date Event Price List to Sale Price per Sq Ft Prior Sale
02/03/2017 02/03/17 Sold $66,000 -5.6% $54 / Sq Ft View Prior Sale
12/30/2016 12/30/16 Pending -- -- --
12/15/2016 12/15/16 For Sale $69,900 -- $58 / Sq Ft

Tax History Compared to Growth

Source: Public Records

Tax History

Year Tax Paid Tax Assessment Tax Assessment Total Assessment is a certain percentage of the fair market value that is determined by local assessors to be the total taxable value of land and additions on the property. Land Improvement
2024 $3,355 $36,446 $3,433 $33,013
2023 $2,982 $31,255 $3,032 $28,223
2022 $2,848 $29,045 $2,818 $26,227
2021 $2,788 $28,303 $2,746 $25,557
2020 $2,632 $27,139 $2,633 $24,506
2019 $2,566 $26,372 $2,559 $23,813
2018 $2,485 $24,849 $2,411 $22,438
2017 $2,413 $24,409 $2,368 $22,041
2016 $1,740 $24,912 $2,417 $22,495
2015 $1,037 $26,312 $2,553 $23,759
2012 -- $25,437 $2,468 $22,969
Source: Public Records

Agents Affiliated with this Home

  • Section Image
  • Section Image
  • Section Image
See All Agents

Map