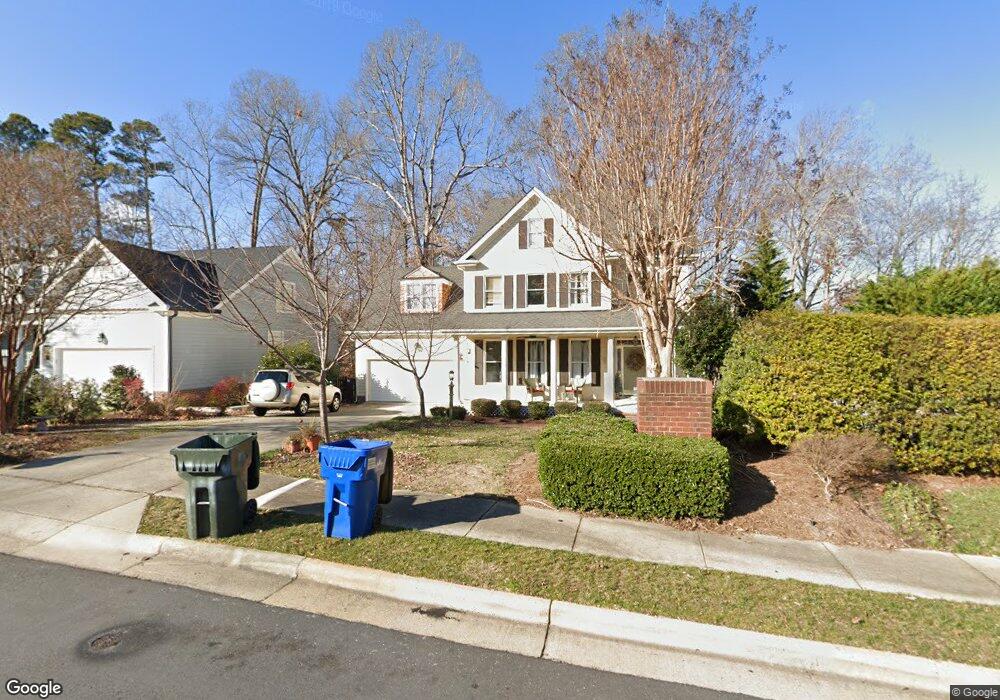
1219 Walkertown Dr Raleigh, NC 27614
Estimated Value: $605,958 - $637,000
4
Beds
3
Baths
2,583
Sq Ft
$240/Sq Ft
Est. Value
About This Home
This home is located at 1219 Walkertown Dr, Raleigh, NC 27614 and is currently estimated at $619,990, approximately $240 per square foot. 1219 Walkertown Dr is a home located in Wake County with nearby schools including Abbotts Creek Elementary School, East Millbrook Middle, and Millbrook High School.
Ownership History
Date
Name
Owned For
Owner Type
Purchase Details
Closed on
Sep 20, 2021
Sold by
Stanner Jodi L and Driscoll Andrew James
Bought by
Stanner Jodi L and Stanner Driscoll Revocable Tru
Current Estimated Value
Purchase Details
Closed on
Jun 15, 2017
Sold by
Driscoll Andrew James and Andrew James Driscoll Trust
Bought by
Driscoll Andrew James
Purchase Details
Closed on
Jul 18, 2001
Sold by
Homes By Dickerson Inc
Bought by
Driscoll Glenn M and Stanner Driscoll Jodi L
Home Financials for this Owner
Home Financials are based on the most recent Mortgage that was taken out on this home.
Original Mortgage
$201,900
Outstanding Balance
$73,444
Interest Rate
6.37%
Estimated Equity
$546,546
Purchase Details
Closed on
Feb 20, 2001
Sold by
Poohbear Development Company
Bought by
Homes By Dickerson Inc
Create a Home Valuation Report for This Property
The Home Valuation Report is an in-depth analysis detailing your home's value as well as a comparison with similar homes in the area
Home Values in the Area
Average Home Value in this Area
Purchase History
| Date | Buyer | Sale Price | Title Company |
|---|---|---|---|
| Stanner Jodi L | -- | None Available | |
| Driscoll Andrew James | -- | None Available | |
| Driscoll Glenn M | $252,500 | -- | |
| Homes By Dickerson Inc | $140,000 | -- |
Source: Public Records
Mortgage History
| Date | Status | Borrower | Loan Amount |
|---|---|---|---|
| Open | Driscoll Glenn M | $201,900 | |
| Closed | Driscoll Glenn M | $25,250 |
Source: Public Records
Tax History Compared to Growth
Tax History
| Year | Tax Paid | Tax Assessment Tax Assessment Total Assessment is a certain percentage of the fair market value that is determined by local assessors to be the total taxable value of land and additions on the property. | Land | Improvement |
|---|---|---|---|---|
| 2025 | $4,578 | $522,695 | $99,000 | $423,695 |
| 2024 | $4,560 | $522,695 | $99,000 | $423,695 |
| 2023 | $4,100 | $374,354 | $93,500 | $280,854 |
| 2022 | $3,810 | $374,354 | $93,500 | $280,854 |
| 2021 | $3,662 | $374,354 | $93,500 | $280,854 |
| 2020 | $3,596 | $374,354 | $93,500 | $280,854 |
| 2019 | $3,589 | $308,001 | $60,350 | $247,651 |
| 2018 | $3,071 | $279,264 | $60,350 | $218,914 |
| 2017 | $2,925 | $279,264 | $60,350 | $218,914 |
| 2016 | $2,865 | $279,264 | $60,350 | $218,914 |
| 2015 | $3,402 | $326,631 | $60,800 | $265,831 |
| 2014 | $3,227 | $326,631 | $60,800 | $265,831 |
Source: Public Records
Map
Nearby Homes
- 1404 Mitford Woods Ct
- 1301 Durlain Dr Unit 103
- 10506 Pleasant Branch Dr Unit Lot 38
- 1310 Durlain Dr Unit 103
- 10520 Pleasant Branch Dr Unit Lot 32
- 10534 Pleasant Branch Dr Unit Lot 30
- 10542 Pleasant Branch Dr Unit Lot 27
- 10531 Pleasant Branch Dr Unit 201
- 10546 Pleasant Branch Dr Unit Lot 25
- 10548 Pleasant Branch Dr Unit Lot 24
- 10552 Pleasant Branch Dr Unit Lot 23
- 10554 Pleasant Branch Dr Unit Lot 22
- 10556 Pleasant Branch Dr Unit Lot 21
- 10547 Pleasant Branch Dr Unit 201
- 10558 Pleasant Branch Dr Unit Lot 20
- 10549 Pleasant Branch Dr Unit 201
- 10549 Pleasant Branch Dr Unit 101
- 10560 Pleasant Branch Dr Unit Lot 19
- 10562 Pleasant Branch Dr Unit Lot 18
- 10602 Pleasant Branch Dr Unit Lot 17
- 1215 Walkertown Dr
- 1301 Walkertown Dr
- 1209 Walkertown Dr
- 1400 Kings Lassiter Way
- 1401 Kings Lassiter Way
- 1216 Walkertown Dr
- 10412 Rocky Ford Ct
- 1205 Walkertown Dr
- 1208 Walkertown Dr
- 1405 Kings Lassiter Way
- 1201 Walkertown Dr
- 1204 Walkertown Dr
- 1409 Kings Lassiter Way
- 10317 Tanners Mill Place
- 909 Walkertown Dr
- 10415 Rocky Ford Ct
- 1408 Kings Lassiter Way
- 1325 Walkertown Dr
- 10313 Tanners Mill Place
- 1200 Walkertown Dr