A
Seller's Agent in 2024
Andre Cunha
Keller Williams South Watuppa
(774) 627-7207
1 in this area
19 Total Sales


Estimated Value: $304,000 - $400,000
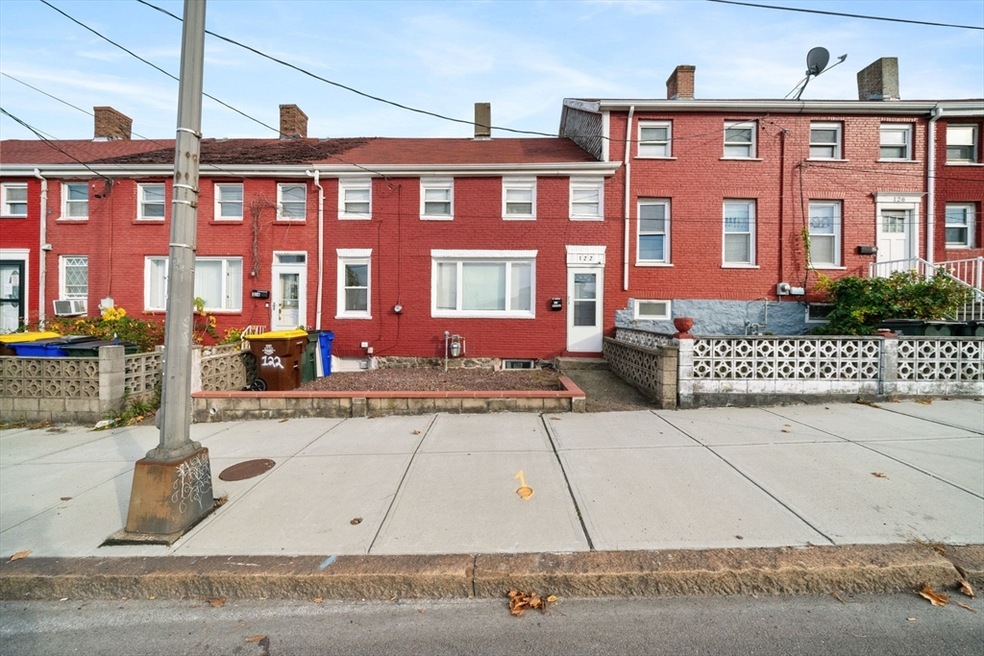
OPEN HOUSE CANCELED ON 11/4/2024. Welcome to this charming home located in well-established neighborhood in Fall River. With recent updates throughout, this move-in-ready property offers a perfect blend of modern comfort and spacious living. This home has 3 bedrooms with the possibility of a 4th or an office space and two full baths. Amenities include restaurants, water front, shops, cafes, T-station and much more all within walking distance. Conveniently located near major routes for easy commuting. You don't want to miss out on this one, schedule a showing today!
| Date | Buyer | Sale Price | Title Company |
|---|---|---|---|
| Anjum Kamran | $349,000 | None Available | |
| Anjum Kamran | $349,000 | None Available | |
| Paiva Shane J | $239,000 | None Available | |
| Paiva Shane J | $239,000 | None Available | |
| Ruby Housing Llc | $131,000 | -- | |
| Marks Christopher J | $149,000 | -- | |
| Marks Christopher J | $149,000 | -- |
| Date | Status | Borrower | Loan Amount |
|---|---|---|---|
| Open | Anjum Kamran | $320,000 | |
| Closed | Anjum Kamran | $320,000 | |
| Previous Owner | Paiva Shane J | $231,830 | |
| Previous Owner | Marks Christopher J | $152,203 | |
| Previous Owner | Marks Christopher J | $68,000 | |
| Previous Owner | Marks Christopher J | $58,800 |
| Date | Event | Price | List to Sale | Price per Sq Ft | Prior Sale |
|---|---|---|---|---|---|
| 12/16/2024 12/16/24 | Sold | $349,000 | -1.7% | $236 / Sq Ft | |
| 11/04/2024 11/04/24 | Pending | -- | -- | -- | |
| 11/01/2024 11/01/24 | For Sale | $354,900 | +48.5% | $240 / Sq Ft | |
| 11/13/2020 11/13/20 | Sold | $239,000 | 0.0% | $145 / Sq Ft | View Prior Sale |
| 09/15/2020 09/15/20 | Pending | -- | -- | -- | |
| 09/04/2020 09/04/20 | For Sale | $239,000 | 0.0% | $145 / Sq Ft | |
| 08/02/2020 08/02/20 | Pending | -- | -- | -- | |
| 07/23/2020 07/23/20 | Price Changed | $239,000 | -0.2% | $145 / Sq Ft | |
| 07/08/2020 07/08/20 | Price Changed | $239,500 | -0.2% | $145 / Sq Ft | |
| 05/27/2020 05/27/20 | Price Changed | $239,900 | -3.7% | $145 / Sq Ft | |
| 05/13/2020 05/13/20 | Price Changed | $249,000 | -0.4% | $151 / Sq Ft | |
| 04/04/2020 04/04/20 | For Sale | $249,900 | +90.8% | $151 / Sq Ft | |
| 11/07/2019 11/07/19 | Sold | $131,000 | 0.0% | $117 / Sq Ft | View Prior Sale |
| 10/03/2019 10/03/19 | Pending | -- | -- | -- | |
| 09/26/2019 09/26/19 | Price Changed | $131,000 | -20.6% | $117 / Sq Ft | |
| 07/27/2019 07/27/19 | For Sale | $165,000 | +10.7% | $148 / Sq Ft | |
| 09/28/2017 09/28/17 | Sold | $149,000 | +2.1% | $134 / Sq Ft | View Prior Sale |
| 08/08/2017 08/08/17 | Pending | -- | -- | -- | |
| 07/25/2017 07/25/17 | For Sale | $145,900 | 0.0% | $131 / Sq Ft | |
| 07/05/2017 07/05/17 | Pending | -- | -- | -- | |
| 05/28/2017 05/28/17 | Price Changed | $145,900 | -2.7% | $131 / Sq Ft | |
| 05/19/2017 05/19/17 | Price Changed | $149,900 | -0.1% | $134 / Sq Ft | |
| 05/03/2017 05/03/17 | For Sale | $150,000 | -- | $134 / Sq Ft |
| Year | Tax Paid | Tax Assessment Tax Assessment Total Assessment is a certain percentage of the fair market value that is determined by local assessors to be the total taxable value of land and additions on the property. | Land | Improvement |
|---|---|---|---|---|
| 2025 | $2,734 | $238,800 | $105,500 | $133,300 |
| 2024 | $2,696 | $234,600 | $101,600 | $133,000 |
| 2023 | $2,487 | $202,700 | $83,900 | $118,800 |
| 2022 | $2,508 | $198,700 | $79,900 | $118,800 |
| 2021 | $2,199 | $159,000 | $76,000 | $83,000 |
| 2020 | $2,128 | $147,300 | $74,900 | $72,400 |
| 2019 | $2,196 | $150,600 | $72,200 | $78,400 |
| 2018 | $2,382 | $162,900 | $78,100 | $84,800 |
| 2017 | $2,204 | $157,400 | $74,500 | $82,900 |
| 2016 | $2,211 | $162,200 | $79,300 | $82,900 |
| 2015 | $2,163 | $165,400 | $79,300 | $86,100 |
| 2014 | $2,051 | $163,000 | $76,900 | $86,100 |
A
Seller's Agent in 2024
Andre Cunha
Keller Williams South Watuppa
(774) 627-7207
1 in this area
19 Total Sales
K
Buyer's Agent in 2024
Karoline Willis
Lamacchia Realty, Inc.
(508) 510-7624
1 in this area
35 Total Sales

Seller's Agent in 2020
Manny Lindo
Highland Real Estate Group
(508) 207-3777
5 in this area
82 Total Sales
T
Buyer's Agent in 2020
The Pereira Group
Century 21 Limitless
(774) 526-2616
3 in this area
51 Total Sales
Seller's Agent in 2019
Marcy Fasano
Dream Home Realty
(508) 725-8696
1 in this area
57 Total Sales
M
Seller's Agent in 2017
Mark and Melissa Team
revolv Real Estate
Source: MLS Property Information Network (MLS PIN)
MLS Number: 73308718
APN: FALL-000003I-000000-000028
Disclaimer: Certain information contained herein is derived from information provided by parties other than Homes.com. All information provided is deemed reliable, but is not guaranteed to be accurate and should be independently verified.
![]() The property listing data and information, or the Images, set forth herein were provided to MLS Property Information Network, Inc. from third party sources, including sellers, lessors and public records, and were compiled by MLS Property Information Network, Inc. The property listing data and information, and the Images, are for the personal, non-commercial use of consumers having a good faith interest in purchasing or leasing listed properties of the type displayed to them and may not be used for any purpose other than to identify prospective properties which such consumers may have a good faith interest in purchasing or leasing. MLS Property Information Network, Inc. and its subscribers disclaim any and all representations and warranties as to the accuracy of the property listing data and information, or as to the accuracy of any of the Images, set forth herein.
The property listing data and information, or the Images, set forth herein were provided to MLS Property Information Network, Inc. from third party sources, including sellers, lessors and public records, and were compiled by MLS Property Information Network, Inc. The property listing data and information, and the Images, are for the personal, non-commercial use of consumers having a good faith interest in purchasing or leasing listed properties of the type displayed to them and may not be used for any purpose other than to identify prospective properties which such consumers may have a good faith interest in purchasing or leasing. MLS Property Information Network, Inc. and its subscribers disclaim any and all representations and warranties as to the accuracy of the property listing data and information, or as to the accuracy of any of the Images, set forth herein.
Ask me questions while you tour the home.