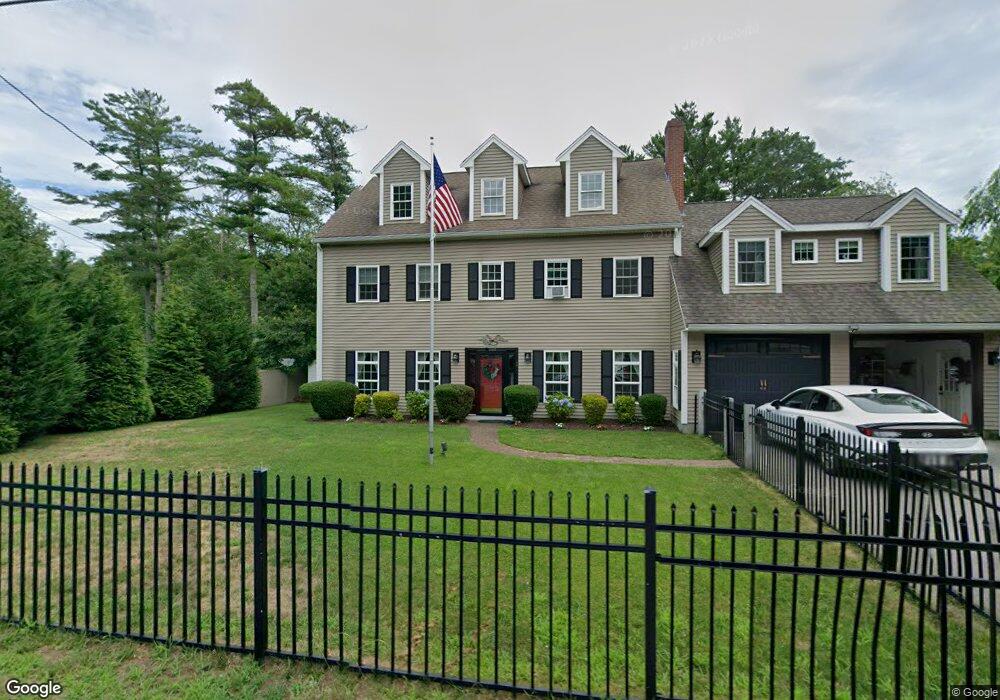
122 Chapel St Pembroke, MA 02359
Estimated Value: $639,000 - $989,000
5
Beds
4
Baths
3,512
Sq Ft
$242/Sq Ft
Est. Value
About This Home
This home is located at 122 Chapel St, Pembroke, MA 02359 and is currently estimated at $849,142, approximately $241 per square foot. 122 Chapel St is a home located in Plymouth County with nearby schools including Pembroke High School and Bay Farm Montessori Academy.
Ownership History
Date
Name
Owned For
Owner Type
Purchase Details
Closed on
Jun 27, 2011
Sold by
Macdonald Richard G
Bought by
Macdonald Richard G and Macdonald Nicole M
Current Estimated Value
Home Financials for this Owner
Home Financials are based on the most recent Mortgage that was taken out on this home.
Original Mortgage
$407,000
Outstanding Balance
$279,955
Interest Rate
4%
Mortgage Type
Purchase Money Mortgage
Estimated Equity
$569,187
Purchase Details
Closed on
Oct 19, 2007
Sold by
Long Wendy
Bought by
Macdonald Richard G
Purchase Details
Closed on
Sep 27, 2000
Sold by
Dyer Robert G and Dyer Deborah Ae
Bought by
Long Wendy and Macdonald Richard G
Purchase Details
Closed on
Aug 29, 1991
Sold by
Flaherty John M and Flaherty Angela F
Bought by
Dyer Robert G and Elsner Deborah
Purchase Details
Closed on
Nov 9, 1987
Sold by
Flaherty John M
Bought by
Flaherty John M
Create a Home Valuation Report for This Property
The Home Valuation Report is an in-depth analysis detailing your home's value as well as a comparison with similar homes in the area
Home Values in the Area
Average Home Value in this Area
Purchase History
| Date | Buyer | Sale Price | Title Company |
|---|---|---|---|
| Macdonald Richard G | -- | -- | |
| Macdonald Richard G | $40,000 | -- | |
| Long Wendy | $193,100 | -- | |
| Dyer Robert G | $124,500 | -- | |
| Flaherty John M | $140,000 | -- |
Source: Public Records
Mortgage History
| Date | Status | Borrower | Loan Amount |
|---|---|---|---|
| Open | Macdonald Richard G | $407,000 | |
| Previous Owner | Flaherty John M | $252,800 | |
| Previous Owner | Flaherty John M | $215,000 |
Source: Public Records
Tax History Compared to Growth
Tax History
| Year | Tax Paid | Tax Assessment Tax Assessment Total Assessment is a certain percentage of the fair market value that is determined by local assessors to be the total taxable value of land and additions on the property. | Land | Improvement |
|---|---|---|---|---|
| 2025 | $9,704 | $807,300 | $255,700 | $551,600 |
| 2024 | $9,439 | $784,600 | $235,300 | $549,300 |
| 2023 | $8,552 | $672,300 | $235,300 | $437,000 |
| 2022 | $8,135 | $574,900 | $192,600 | $382,300 |
| 2021 | $7,621 | $522,700 | $183,700 | $339,000 |
| 2020 | $7,367 | $508,400 | $175,500 | $332,900 |
| 2019 | $7,138 | $488,900 | $171,000 | $317,900 |
| 2018 | $6,765 | $454,300 | $153,000 | $301,300 |
| 2017 | $6,703 | $443,900 | $144,700 | $299,200 |
| 2016 | $6,640 | $435,100 | $136,500 | $298,600 |
| 2015 | $5,578 | $378,400 | $123,900 | $254,500 |
Source: Public Records
Map
Nearby Homes
- 96 Lake Shore Dr
- 61 Chapel St
- 202 Birch St
- 65 Hitty Tom Rd
- 345 Forest St
- 9 Montclair Ave
- 15 Autumn Ave
- 0 Wildwood Cir
- 600 Summer St Unit 6
- 7 Barbara Rd
- 346 Summer St
- 6 Carriage Ln Unit 6
- 27 Chestnut Rd
- 64 Trout Farm Ln
- 234 Forest St
- 7 Green Holly Dr
- 42 Trout Farm Ln Unit 2
- 0 Kingstown Way
- 17 Trout Farm Ln
- 0 East St