Estimated Value: $644,318 - $782,000
5
Beds
4
Baths
3,141
Sq Ft
$232/Sq Ft
Est. Value
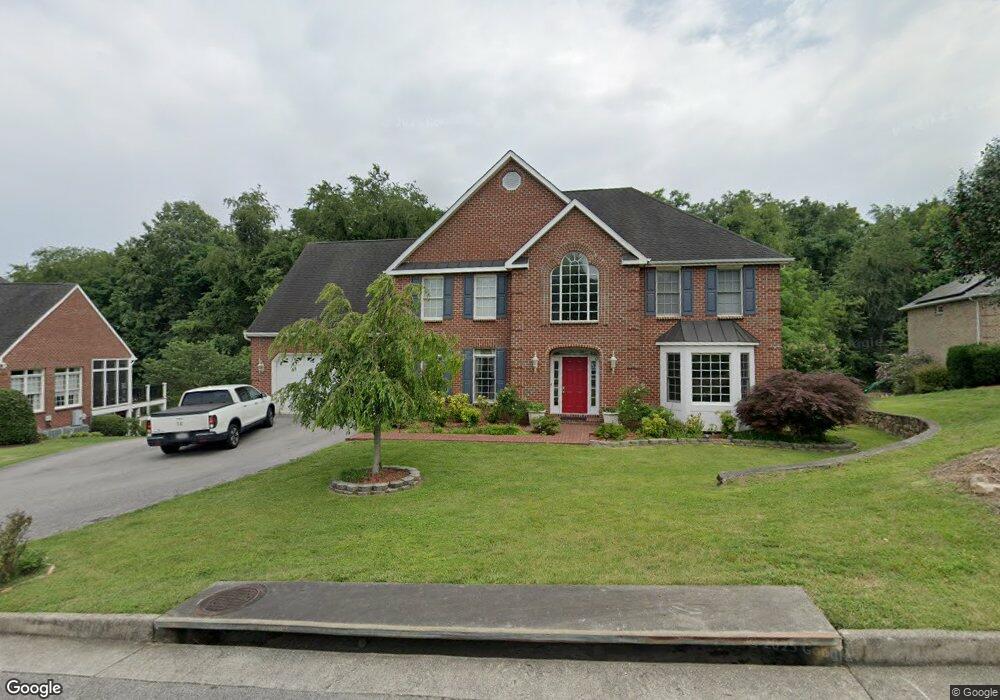
About This Home
This home is located at 122 Ferrum Dr, Salem, VA 24153 and is currently estimated at $727,830, approximately $231 per square foot. 122 Ferrum Dr is a home located in Salem City with nearby schools including East Salem Elementary School, Andrew Lewis Middle School, and Salem High School.
Ownership History
Date
Name
Owned For
Owner Type
Purchase Details
Closed on
May 5, 2006
Sold by
Charles R Simpson Inc
Bought by
Truong Hong L and Duong Khai C
Current Estimated Value
Home Financials for this Owner
Home Financials are based on the most recent Mortgage that was taken out on this home.
Original Mortgage
$42,950
Outstanding Balance
$25,088
Interest Rate
6.55%
Mortgage Type
Credit Line Revolving
Estimated Equity
$702,742
Purchase Details
Closed on
Nov 3, 2005
Sold by
Salem Enterprises L L C
Bought by
Charles R Simpson Inc
Create a Home Valuation Report for This Property
The Home Valuation Report is an in-depth analysis detailing your home's value as well as a comparison with similar homes in the area
Home Values in the Area
Average Home Value in this Area
Purchase History
| Date | Buyer | Sale Price | Title Company |
|---|---|---|---|
| Truong Hong L | -- | None Available | |
| Charles R Simpson Inc | $157,427 | None Available |
Source: Public Records
Mortgage History
| Date | Status | Borrower | Loan Amount |
|---|---|---|---|
| Open | Truong Hong L | $42,950 | |
| Open | Truong Hong L | $417,000 |
Source: Public Records
Tax History
| Year | Tax Paid | Tax Assessment Tax Assessment Total Assessment is a certain percentage of the fair market value that is determined by local assessors to be the total taxable value of land and additions on the property. | Land | Improvement |
|---|---|---|---|---|
| 2025 | $3,536 | $599,300 | $78,200 | $521,100 |
| 2024 | $3,368 | $561,300 | $74,400 | $486,900 |
| 2023 | $6,131 | $510,900 | $68,900 | $442,000 |
| 2022 | $5,792 | $482,700 | $63,900 | $418,800 |
| 2021 | $5,587 | $465,600 | $60,600 | $405,000 |
| 2020 | $5,376 | $448,000 | $57,800 | $390,200 |
| 2019 | $5,244 | $437,000 | $57,800 | $379,200 |
| 2018 | $5,125 | $434,300 | $55,100 | $379,200 |
| 2017 | $5,384 | $456,300 | $55,100 | $401,200 |
| 2016 | $5,384 | $456,300 | $55,100 | $401,200 |
| 2015 | $5,679 | $481,300 | $57,500 | $423,800 |
| 2014 | $5,679 | $481,300 | $57,500 | $423,800 |
Source: Public Records
Map
Nearby Homes
- 106 Diamond Rd
- 48 Upland Dr
- 13 Upland Dr
- 102 Simms Blvd
- 405 Diamond Rd
- 137 Parker Ln
- 916 Homestead Dr
- 912 Homestead Dr
- 134 Parker Ln
- 130 Parker Ln
- 122 Parker Ln
- 1905 McVitty Rd
- 2409 S Clearing Rd
- 2831 W Club Dr
- 1508 Orchard Dr
- 2437 S Clearing Rd
- 2509 S Clearing Rd
- 2404 Post Oak Rd
- 2518 S Clearing Rd
- 2428 Post Oak Rd
Your Personal Tour Guide
Ask me questions while you tour the home.