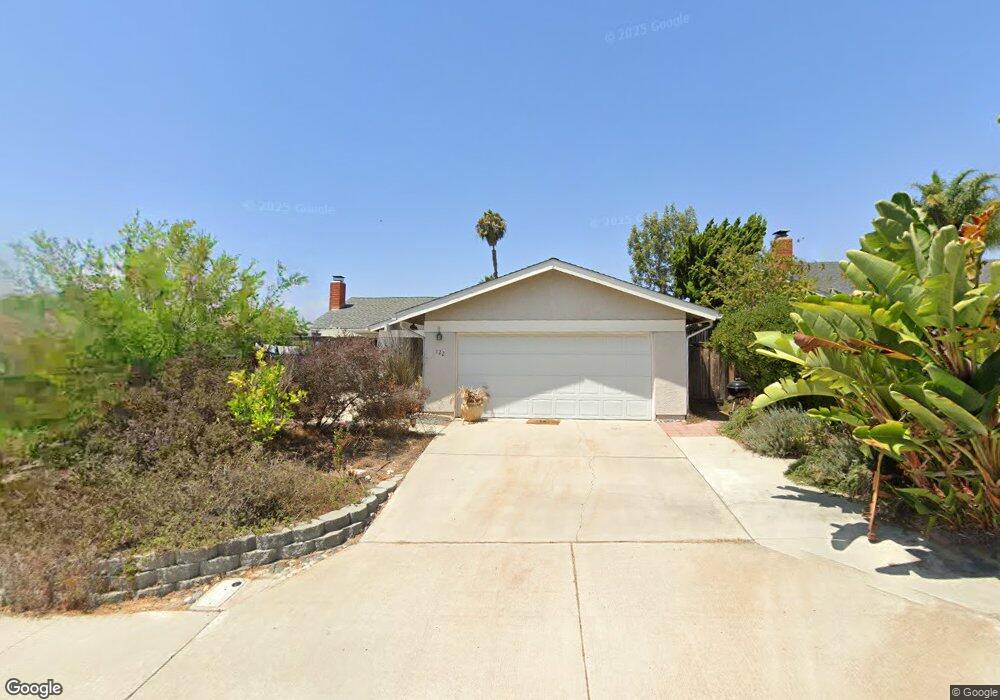
122 Five Crowns Way Encinitas, CA 92024
Central Encinitas NeighborhoodEstimated Value: $1,253,000 - $1,644,000
3
Beds
2
Baths
1,386
Sq Ft
$1,064/Sq Ft
Est. Value
About This Home
This home is located at 122 Five Crowns Way, Encinitas, CA 92024 and is currently estimated at $1,474,072, approximately $1,063 per square foot. 122 Five Crowns Way is a home located in San Diego County with nearby schools including Park Dale Lane Elementary, Diegueno Middle School, and La Costa Canyon High School.
Ownership History
Date
Name
Owned For
Owner Type
Purchase Details
Closed on
Aug 20, 1996
Sold by
Griffith Family Trust 02-05-94 and Griffith Russellevan
Bought by
Igasaki Kevin A and Bellier Igasaki Catherine M P
Current Estimated Value
Home Financials for this Owner
Home Financials are based on the most recent Mortgage that was taken out on this home.
Original Mortgage
$146,000
Outstanding Balance
$11,562
Interest Rate
8.23%
Estimated Equity
$1,462,510
Purchase Details
Closed on
Feb 5, 1994
Sold by
Griffith Russell Evan and Griffith Cynthia G
Bought by
Griffith Russell Evan and Griffith Cynthia G
Purchase Details
Closed on
Jun 30, 1988
Create a Home Valuation Report for This Property
The Home Valuation Report is an in-depth analysis detailing your home's value as well as a comparison with similar homes in the area
Home Values in the Area
Average Home Value in this Area
Purchase History
| Date | Buyer | Sale Price | Title Company |
|---|---|---|---|
| Igasaki Kevin A | $182,500 | Guardian Title Company | |
| Griffith Russell Evan | -- | -- | |
| -- | $164,000 | -- |
Source: Public Records
Mortgage History
| Date | Status | Borrower | Loan Amount |
|---|---|---|---|
| Open | Igasaki Kevin A | $146,000 |
Source: Public Records
Tax History
| Year | Tax Paid | Tax Assessment Tax Assessment Total Assessment is a certain percentage of the fair market value that is determined by local assessors to be the total taxable value of land and additions on the property. | Land | Improvement |
|---|---|---|---|---|
| 2025 | $3,673 | $297,045 | $179,143 | $117,902 |
| 2024 | $3,673 | $291,222 | $175,631 | $115,591 |
| 2023 | $3,540 | $285,513 | $172,188 | $113,325 |
| 2022 | $3,436 | $279,915 | $168,812 | $111,103 |
| 2021 | $3,359 | $274,427 | $165,502 | $108,925 |
| 2020 | $3,289 | $271,614 | $163,805 | $107,809 |
| 2019 | $3,227 | $266,290 | $160,594 | $105,696 |
| 2018 | $3,183 | $261,070 | $157,446 | $103,624 |
| 2017 | $191 | $255,952 | $154,359 | $101,593 |
| 2016 | $3,042 | $250,934 | $151,333 | $99,601 |
| 2015 | $2,973 | $247,165 | $149,060 | $98,105 |
| 2014 | $2,891 | $242,325 | $146,141 | $96,184 |
Source: Public Records
Map
Nearby Homes
- 1741 Charleston Ln
- 1926 Springdale Ln
- 1822 Stanton Rd Unit 302
- 1824 Eastwood Ln
- 1644 Forestdale Dr
- 277 Via Del Cerrito
- 2118 Valleydale Ln
- 1830 Gatepost Rd
- 245 Fairlee Ln
- 1982 Fairlee Dr
- 121 Avenida Esperanza
- 324 Countrywood Ln
- 516 Whisper Wind Dr
- 2037 Countrywood Way
- 349 Horizon Dr
- 1971 Azure Way
- 1517 Shields Ave
- 1709 Edgefield Ln
- 608 Crest Dr
- 1642 Blossom Field Way
- 128 Five Crowns Way
- 116 Five Crowns Way
- 119 Oxbow Ln
- 113 Oxbow Ln
- 134 Five Crowns Way
- 110 Five Crowns Way
- 125 Oxbow Ln
- 107 Oxbow Ln
- 117 Five Crowns Way
- 140 Five Crowns Way
- 123 Five Crowns Way
- 111 Five Crowns Way
- 104 Five Crowns Way
- 131 Oxbow Ln
- 101 Oxbow Ln
- 2050 Village Wood Rd
- 146 Five Crowns Way
- 135 Five Crowns Way
- 137 Oxbow Ln
- 2056 Village Wood Rd
Your Personal Tour Guide
Ask me questions while you tour the home.