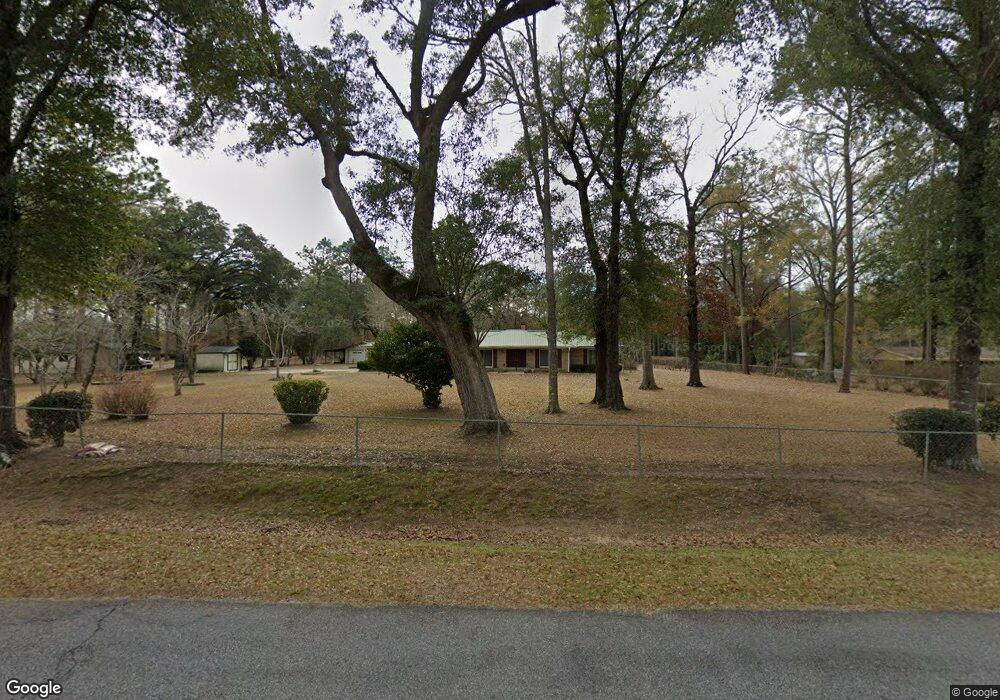
122 Flint River Heights Rd Bainbridge, GA 39817
Estimated Value: $246,980 - $332,000
--
Bed
1
Bath
1,845
Sq Ft
$157/Sq Ft
Est. Value
About This Home
This home is located at 122 Flint River Heights Rd, Bainbridge, GA 39817 and is currently estimated at $288,995, approximately $156 per square foot. 122 Flint River Heights Rd is a home located in Decatur County with nearby schools including Bainbridge High School.
Create a Home Valuation Report for This Property
The Home Valuation Report is an in-depth analysis detailing your home's value as well as a comparison with similar homes in the area
Home Values in the Area
Average Home Value in this Area
Tax History Compared to Growth
Tax History
| Year | Tax Paid | Tax Assessment Tax Assessment Total Assessment is a certain percentage of the fair market value that is determined by local assessors to be the total taxable value of land and additions on the property. | Land | Improvement |
|---|---|---|---|---|
| 2024 | $2,218 | $80,542 | $11,720 | $68,822 |
| 2023 | $1,795 | $80,542 | $11,720 | $68,822 |
| 2022 | $1,987 | $70,288 | $3,716 | $66,572 |
| 2021 | $1,798 | $62,640 | $3,716 | $58,924 |
| 2020 | $1,643 | $54,606 | $3,716 | $50,890 |
| 2019 | $1,572 | $50,470 | $3,902 | $46,568 |
| 2018 | $1,553 | $50,470 | $3,902 | $46,568 |
| 2017 | $1,584 | $50,470 | $3,902 | $46,568 |
| 2016 | $1,521 | $50,470 | $3,902 | $46,568 |
| 2015 | $1,542 | $50,470 | $3,902 | $46,568 |
| 2014 | $1,345 | $50,470 | $3,902 | $46,568 |
| 2013 | -- | $50,470 | $3,902 | $46,568 |
Source: Public Records
Map
Nearby Homes
- 116 Flint River Heights Rd
- 104 Brock St
- 186 Aryola Dr
- Tract 1 Rivervale Dr
- 150 Rivervale Dr
- 757 Manhole Rd
- 533 Flint River Heights Rd
- 00 Manhole Rd
- 116 Rivervale Dr
- 0 Pine St Unit 10993
- 2137 Pondtown Rd
- 287 Cloverleaf Cir
- 160 Manhole Rd
- 000 E River Rd
- 2036 Lexington Ave
- 467 745 Lot St N
- 2032 Lexington Ave
- 1302 Majestic Ave
- 604 Martin St
- 1603 Plantation Rd
- 132 Flint River Heights Rd
- 1682 Newton Rd
- 144 Flint River Heights Rd
- Lot 1 Flint River Hights Rd
- 133 Flint River Heights Rd
- 127 Flint River Heights Rd
- 130 Flint River Heights Rd
- 164 Flint River Heights Rd
- 166 Flint River Heights Rd
- 163 Flint River Heights Rd
- 127 Brock St
- 111 Brock St
- 107 Brock St
- 1843 Flint River Heights Rd
- 122 Brock St
- 114 Brock St
- 168 Flint River Heights Rd
- 182 Aryola Dr
- 176 Aryola Dr
- 172 Aryola Dr