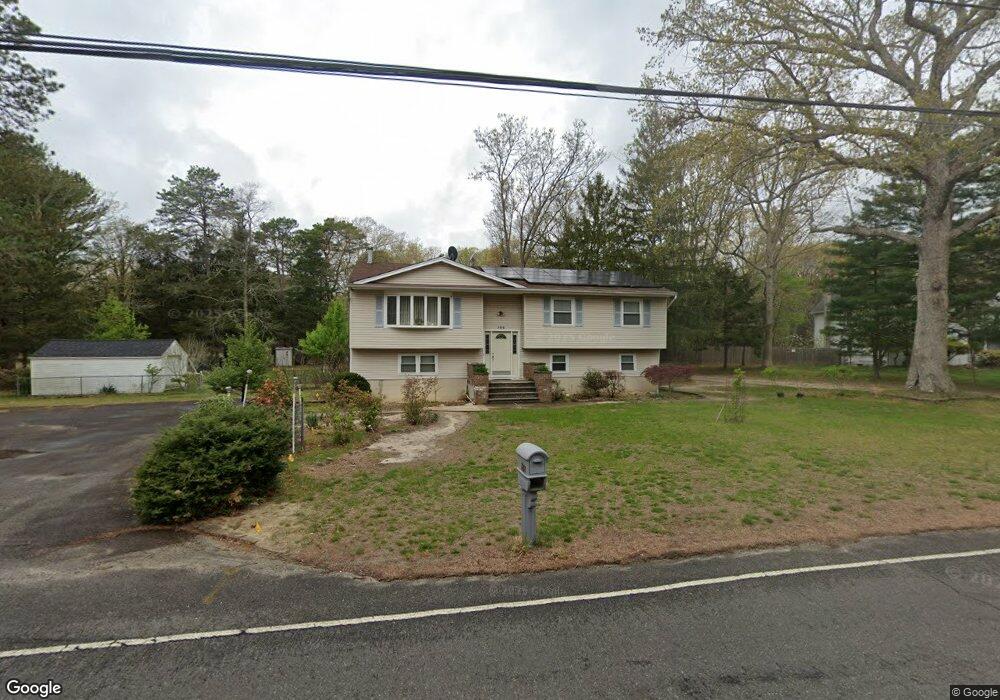
122 Ford Rd Howell, NJ 07731
Southard NeighborhoodEstimated Value: $789,000 - $855,000
4
Beds
3
Baths
2,586
Sq Ft
$316/Sq Ft
Est. Value
About This Home
This home is located at 122 Ford Rd, Howell, NJ 07731 and is currently estimated at $817,145, approximately $315 per square foot. 122 Ford Rd is a home located in Monmouth County with nearby schools including Taunton School, Aldrich School, and Howell Township Middle School South.
Ownership History
Date
Name
Owned For
Owner Type
Purchase Details
Closed on
Mar 13, 2006
Sold by
Falavinha Moacir
Bought by
Dematos John and Dematos Maria
Current Estimated Value
Purchase Details
Closed on
Aug 16, 2005
Sold by
Fay Robin S
Bought by
Falavinha Moacir and Falavinha Leila
Home Financials for this Owner
Home Financials are based on the most recent Mortgage that was taken out on this home.
Original Mortgage
$381,600
Interest Rate
7.4%
Mortgage Type
Adjustable Rate Mortgage/ARM
Create a Home Valuation Report for This Property
The Home Valuation Report is an in-depth analysis detailing your home's value as well as a comparison with similar homes in the area
Home Values in the Area
Average Home Value in this Area
Purchase History
| Date | Buyer | Sale Price | Title Company |
|---|---|---|---|
| Dematos John | $505,000 | -- | |
| Falavinha Moacir | $477,000 | -- |
Source: Public Records
Mortgage History
| Date | Status | Borrower | Loan Amount |
|---|---|---|---|
| Previous Owner | Falavinha Moacir | $381,600 |
Source: Public Records
Tax History Compared to Growth
Tax History
| Year | Tax Paid | Tax Assessment Tax Assessment Total Assessment is a certain percentage of the fair market value that is determined by local assessors to be the total taxable value of land and additions on the property. | Land | Improvement |
|---|---|---|---|---|
| 2025 | $9,512 | $638,400 | $290,100 | $348,300 |
| 2024 | $9,231 | $535,000 | $193,100 | $341,900 |
| 2023 | $9,231 | $496,000 | $162,100 | $333,900 |
| 2022 | $8,841 | $458,200 | $141,000 | $317,200 |
| 2021 | $8,841 | $423,100 | $141,000 | $282,100 |
| 2020 | $9,750 | $419,900 | $141,000 | $278,900 |
| 2019 | $9,738 | $411,600 | $137,500 | $274,100 |
| 2018 | $8,981 | $377,200 | $115,800 | $261,400 |
| 2017 | $8,890 | $369,200 | $115,800 | $253,400 |
| 2016 | $8,685 | $357,100 | $110,100 | $247,000 |
| 2015 | $9,111 | $370,800 | $130,100 | $240,700 |
| 2014 | $7,978 | $301,300 | $110,100 | $191,200 |
Source: Public Records
Map
Nearby Homes