
Seller's Agent in 2025
Zak Fang
Realty Plus, Inc.
(401) 223-4404
1 in this area
7 Total Sales

Estimated Value: $513,000 - $590,000
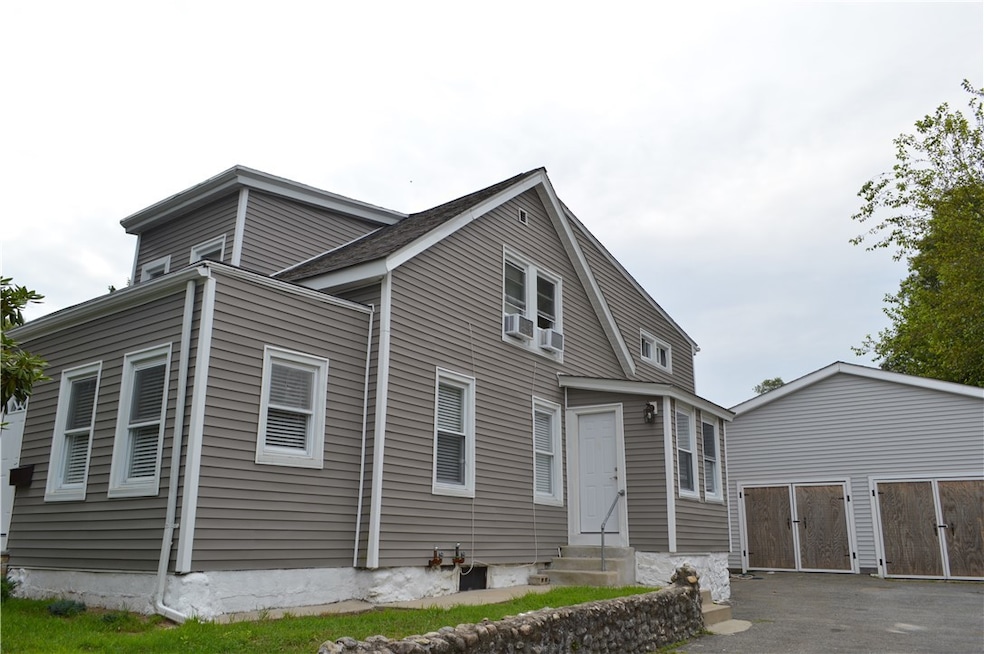
Charming & Updated 2-Family Home in Exclusive Oak Grove Neighborhood: Welcome to 122 Larch St, Woonsocket, RI 02895 a beautifully renovated two-unit home nestled in the exclusive Oak Grove neighborhood, right on the Cumberland border. Offering nearly 2,000 sq ft of move-in-ready living space, this 6-bedroom, 2-bathroom property is ideal for investors or owner-occupants looking for style, space, and smart potential. Each unit features tasteful updates throughout, including: Brand-new roof, durable waterproof flooring, sleek porcelain countertops, stainless steel appliances, and washer & dryer hookups in both bathrooms. The first-floor apartment boasts a spacious living and dining room combo, plus an enclosed finished porch perfect for relaxing or bonus living space. A detached, recently rehabbed 2-car garage offers off-street parking and extra storage. Located with easy access to Route 99, commuting to Providence or northern RI is a breeze. Whether you're looking to live in one unit and rent the other, or expand your investment portfolio, this home is a rare find in a highly desirable, commuter-friendly location.
Last Agent to Sell the Property
Realty Plus, Inc. License #REC.0015310 Listed on: 07/30/2025
We collect this data history from publicly available records. To have your information removed, we recommend requesting removal directly through your county’s website.
We collect this data history from publicly available records. To have your information removed, we recommend requesting removal directly through your county’s website.
| Date | Buyer | Sale Price | Title Company |
|---|---|---|---|
| $520,000 | -- | ||
| $520,000 | -- | ||
| -- | None Available | ||
| -- | None Available | ||
| $116,000 | -- | ||
| $116,000 | -- |
We collect this data history from publicly available records. To have your information removed, we recommend requesting removal directly through your county’s website.
| Date | Status | Borrower | Loan Amount |
|---|---|---|---|
| Open | $468,000 | ||
| Closed | $468,000 | ||
| Previous Owner | $81,200 |
We collect this data history from publicly available records. To have your information removed, we recommend requesting removal directly through your county’s website.
| Date | Event | Price | List to Sale | Price per Sq Ft |
|---|---|---|---|---|
| 11/21/2025 11/21/25 | Sold | $520,000 | +4.0% | $141 / Sq Ft |
| 08/14/2025 08/14/25 | Pending | -- | -- | -- |
| 07/30/2025 07/30/25 | For Sale | $499,900 | -- | $135 / Sq Ft |
We collect this data history from publicly available records. To have your information removed, we recommend requesting removal directly through your county’s website.
| Year | Tax Paid | Tax Assessment Tax Assessment Total Assessment is a certain percentage of the fair market value that is determined by local assessors to be the total taxable value of land and additions on the property. | Land | Improvement |
|---|---|---|---|---|
| 2025 | $4,535 | $403,800 | $104,000 | $299,800 |
| 2024 | $3,743 | $257,400 | $84,900 | $172,500 |
| 2023 | $3,598 | $257,400 | $84,900 | $172,500 |
| 2022 | $3,598 | $257,400 | $84,900 | $172,500 |
| 2021 | $3,871 | $163,000 | $66,000 | $97,000 |
| 2020 | $3,912 | $163,000 | $66,000 | $97,000 |
| 2018 | $3,925 | $163,000 | $66,000 | $97,000 |
| 2017 | $4,145 | $137,700 | $63,000 | $74,700 |
| 2016 | $4,384 | $137,700 | $63,000 | $74,700 |
| 2015 | $5,037 | $137,700 | $63,000 | $74,700 |
| 2014 | $4,988 | $138,800 | $69,300 | $69,500 |
Seller's Agent in 2025
Zak Fang
Realty Plus, Inc.
(401) 223-4404
1 in this area
7 Total Sales
Buyer's Agent in 2025
Brooke Buckett
RE/MAX River's Edge
2 in this area
125 Total Sales
Source: State-Wide MLS
MLS Number: 1390964
APN: WOON-000044C-000240-000021
Disclaimer: Certain information contained herein is derived from information provided by parties other than Homes.com. All information provided is deemed reliable, but is not guaranteed to be accurate and should be independently verified.
![]() IDX information is provided exclusively for personal, non-commercial use, and may not be used for any purpose other than to identify prospective properties consumers may be interested in purchasing. Information is deemed reliable but not guaranteed.
IDX information is provided exclusively for personal, non-commercial use, and may not be used for any purpose other than to identify prospective properties consumers may be interested in purchasing. Information is deemed reliable but not guaranteed.
Copyright © 2026 State-Wide MLS, Inc. All rights reserved.
Ask me questions while you tour the home.