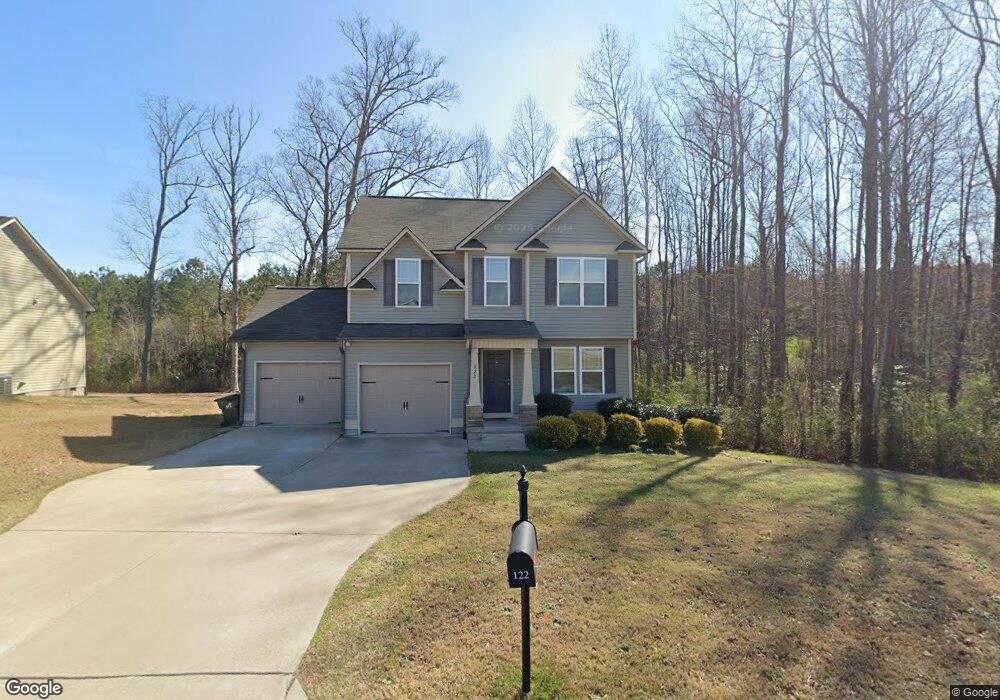
122 Larksdale Cove Benson, NC 27504
Estimated Value: $283,000 - $306,416
3
Beds
3
Baths
1,471
Sq Ft
$201/Sq Ft
Est. Value
About This Home
This home is located at 122 Larksdale Cove, Benson, NC 27504 and is currently estimated at $295,604, approximately $200 per square foot. 122 Larksdale Cove is a home located in Johnston County with nearby schools including Benson Elementary School, Benson Middle School, and South Johnston High School.
Ownership History
Date
Name
Owned For
Owner Type
Purchase Details
Closed on
Jun 18, 2020
Sold by
Secure Inc
Bought by
Burton Ashley
Current Estimated Value
Home Financials for this Owner
Home Financials are based on the most recent Mortgage that was taken out on this home.
Original Mortgage
$5,000
Outstanding Balance
$4,424
Interest Rate
3.1%
Mortgage Type
Stand Alone Second
Estimated Equity
$291,180
Purchase Details
Closed on
Dec 18, 2019
Sold by
State Employees Credit Union
Bought by
Secu Re Inc
Purchase Details
Closed on
Apr 24, 2018
Sold by
Carroll Construction Home Inc
Bought by
Coley Lasadie L and Lowe Tyrus
Home Financials for this Owner
Home Financials are based on the most recent Mortgage that was taken out on this home.
Original Mortgage
$179,900
Interest Rate
4.87%
Mortgage Type
Adjustable Rate Mortgage/ARM
Create a Home Valuation Report for This Property
The Home Valuation Report is an in-depth analysis detailing your home's value as well as a comparison with similar homes in the area
Home Values in the Area
Average Home Value in this Area
Purchase History
| Date | Buyer | Sale Price | Title Company |
|---|---|---|---|
| Burton Ashley | $195,000 | None Available | |
| Secu Re Inc | $148,000 | None Available | |
| Coley Lasadie L | $178,000 | None Available |
Source: Public Records
Mortgage History
| Date | Status | Borrower | Loan Amount |
|---|---|---|---|
| Open | Burton Ashley | $5,000 | |
| Previous Owner | Coley Lasadie L | $179,900 |
Source: Public Records
Tax History Compared to Growth
Tax History
| Year | Tax Paid | Tax Assessment Tax Assessment Total Assessment is a certain percentage of the fair market value that is determined by local assessors to be the total taxable value of land and additions on the property. | Land | Improvement |
|---|---|---|---|---|
| 2025 | $3,325 | $294,280 | $55,000 | $239,280 |
| 2024 | $2,217 | $173,170 | $40,000 | $133,170 |
| 2023 | $2,217 | $173,170 | $40,000 | $133,170 |
| 2022 | $2,217 | $173,170 | $40,000 | $133,170 |
| 2021 | $2,217 | $173,170 | $40,000 | $133,170 |
| 2020 | $2,234 | $173,170 | $40,000 | $133,170 |
| 2019 | $2,234 | $173,170 | $40,000 | $133,170 |
| 2018 | $977 | $74,000 | $26,000 | $48,000 |
| 2017 | $343 | $26,000 | $26,000 | $0 |
| 2016 | $341 | $26,000 | $26,000 | $0 |
| 2015 | $341 | $26,000 | $26,000 | $0 |
| 2014 | $341 | $26,000 | $26,000 | $0 |
Source: Public Records
Map
Nearby Homes
- 124 Hunterwood Place
- 103 Hunterwood Place
- 115 Hunterwood Place
- 166 Tarheel Rd
- 9385 Us 301 Hw
- 9385 U S 301
- 8535 U S 301
- McKimmon Plan at Alder Creek
- Brooks Plan at Alder Creek
- Finley Plan at Alder Creek
- Watauga Plan at Alder Creek
- Clark Plan at Alder Creek
- Winston Plan at Alder Creek
- 37 Gardenia Ct
- 1643 Hannah Creek Rd
- 294 White Azalea Way
- 272 White Azalea Way
- 236 White Azalea Way
- 120 Crystal Place
- Colfax Plan at Weddington
- 120 Larksdale Cove
- 124 Larksdale Cove
- 101 Belle Meade Ct
- 100 Belle Meade Ct
- 118 Larksdale Cove
- 121 Larksdale Cove
- 103 Belle Meade Ct
- 102 Belle Meade Ct Unit 36
- 102 Belle Meade Ct
- 116 Larksdale Cove
- 119 Larksdale Cove
- 105 Belle Meade Ct
- 105 Belle Meade Ct Unit 41
- 104 Belle Meade Ct
- 104 Belle Meade Ct Unit 35
- 117 Larksdale Cove
- 122 Willa Chase Ct Unit 43
- 122 Willa Chase Ct
- 107 Belle Meade Ct
- 118 Willa Chase Ct